Monitoring Console for Redis™
Find Your Monitoring Console for Redis™*
Each ScaleGrid cluster has it's own Monitoring Console to analyze the performance, usage, and availability of your cloud deployments for Redis™. You can find it by going into any of your Redis™ deployments, and then click on the Monitoring icon in your Overview tab.

Here are the metrics you'll be able to analyze through your Monitoring Console for Redis™:
Chart Annotations:Annotations may appear as colored vertical lines on your charts to indicate server events. The color/events combinations are:
Server Role Change: Indicates that the role (Master/Slave) of the server instance changed.
Server Restart: Indicates that the server process restarted.
CPU
CPU metrics are system-level metrics, and allow you to monitor your server processor.
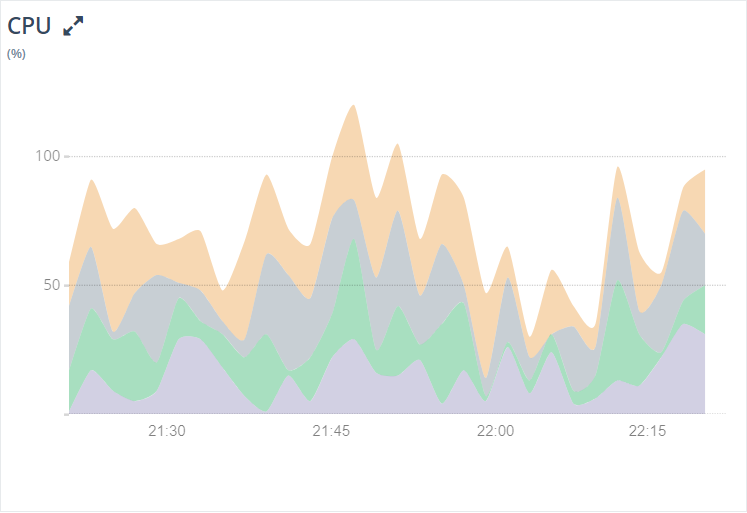
You can monitor your CPU usage on the ScaleGrid Monitoring Console to see whether you've experienced any spikes, analyze idle percentages, and find indications for potential slow queries affecting your CPU load time.
- User (%): The percentage of time the CPU spent in user applications.
- System (%): The percentage of time the CPU spent in the operating system.
- Nice (%): The percentage of time the CPU spent in nice mode.
- IOWAIT (%): The percentage of time the CPU spent waiting for IO operations to complete.
System Memory
The System Memory is the overview of your RAM usage.
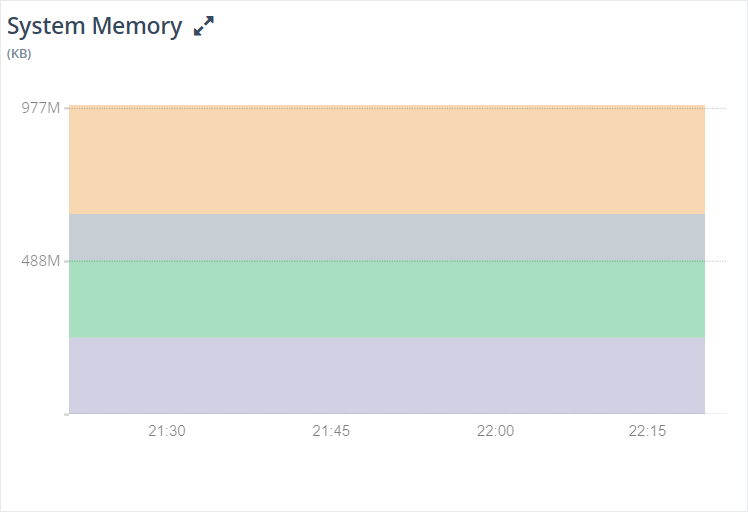
The System Memory charts the overall memory usage of your system to ensure your memory usage is in a healthy range of your capacity and avoid out-of-memory errors. The metrics being reported are:
- Total used memory
- Memory used for buffers
- Page cache
- Free memory
Disk
Even though Redis™ is a memory-based store, it utilizes the disk often for writing AOF and RDB files in order to ensure data persistence. Though not as critical as for disk-based databases, it's important to monitor disk usage for Redis™ too.
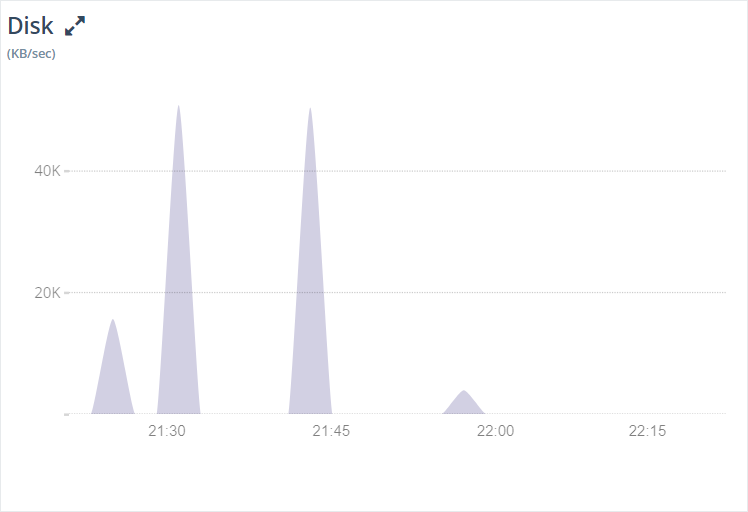
The disk chart outlines your total disk reads/second and total disk writes/second by KB/second.
Slow Query Analysis for Redis™
ScaleGrid provides a set of metrics that allow you to do query analyses. Redis™ divides its commands into 14 groups. The commandstats section of the INFO command provides call statistics for each group. This section provides call frequency for the commands of each group:

|
|
|
|
|
|
|
|
|
|
|
|
|
|
Redis™ Used Memory
Memory is the most critical resource for Redis™ performance. Used memory defines the total number of bytes allocated by Redis™ using its allocator (jemalloc).
The reported usage is the total of memory allocations for data and administrative overheads that a key and its value require. You can find more info here.
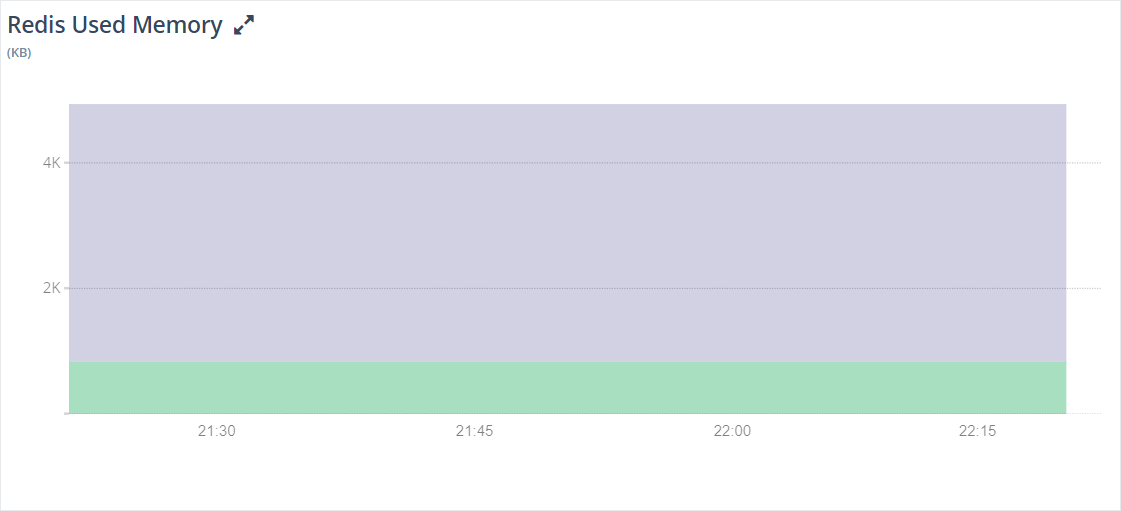
- Used Memory: Total number of bytes allocated by Redis™ using its allocator.
- Used Memory RSS: Number of bytes that Redis™ allocated as seen by the operating system (a.k.a resident set size). This is the number reported by tools such as top(1) and ps(1).
Connection
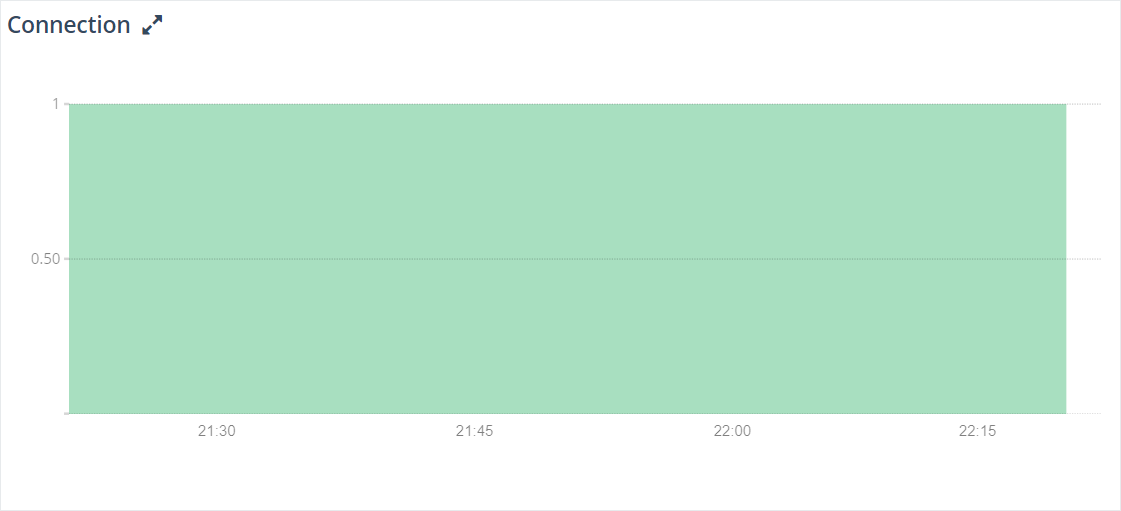
The number of connections is a limited resource which is either enforced by the operating system or by the Redis™ configuration. Monitoring the active connections helps you to ensure that you have sufficient connections to serve all your requests at peak time.
Expired/Evicted Keys
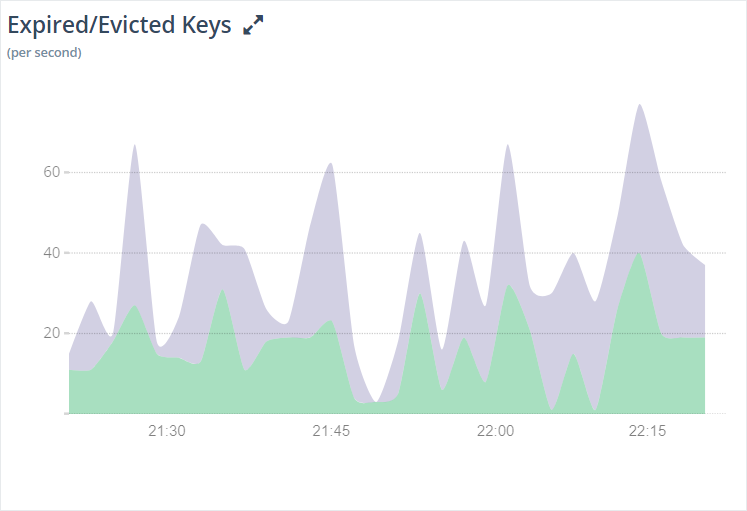
Redis™ supports various eviction policies that are used by the server when memory usage hits the max limit.
When Redis™ reaches the configured maximum memory limit, it begins evicting keys based on the eviction policy set in the configuration. This chart lets you understand the eviction pattern of your Redis™ deployment. If your keys are getting evicted too soon, it indicates that you need to scale the memory up:
Total Keys
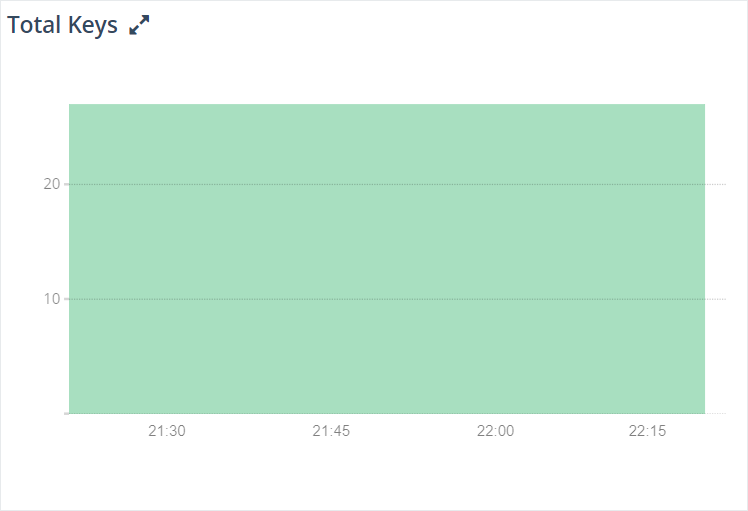
Gives you the total number of keys on your Redis™ server:
Cache Hit Ratio
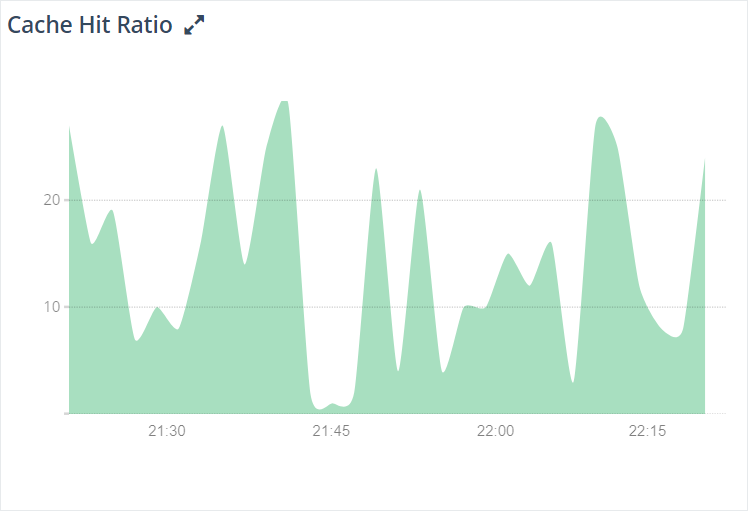
The cache hit ratio represents the efficiency of cache usage. Mathematically, it's defined as (Total key hits) / (Total keys hits + Total key misses).
The stats section of the INFO command output provides key-space_hits and key-space_misses metric data to further calculate cache hit ratio for a running Redis™ instance.
When using Redis™ as a cache, if the cache hit ratio is lower than ~0.8, then a significant amount of the requested keys are evicted, expired, or do not exist at all. It's crucial to watch this metric while using Redis™ as a cache. Lower cache hit ratios result in larger latency as most of the missed requests will have to be served from the backing disk-based database. It indicates that you need to increase the size of Redis™ cache to improve your application’s performance.
Changes Since Last Backup
Gives you a graph of your changes since the last write to the RDB file.

* Redis is a trademark of Redis Labs Ltd. Any rights therein are reserved to Redis Labs Ltd. Any use by ScaleGrid is for referential purposes only and does not indicate any sponsorship, endorsement or affiliation between Redis and ScaleGrid.
Updated 11 months ago
