MySQL InnoDB Metrics
Analyze your MySQL hosting metrics with ScaleGrid DBaaS, including InnoDB storage engine I/O, row operations, buffer pool, transactions, log file usage, checkpoint age, and change buffer activity.
ScaleGrid MySQL hosting and database management solutions come with advanced monitoring metrics to help ensure the continuous health of your deployments. Each cluster comes with it's own unique MySQL Monitoring Console found on your cluster details page.
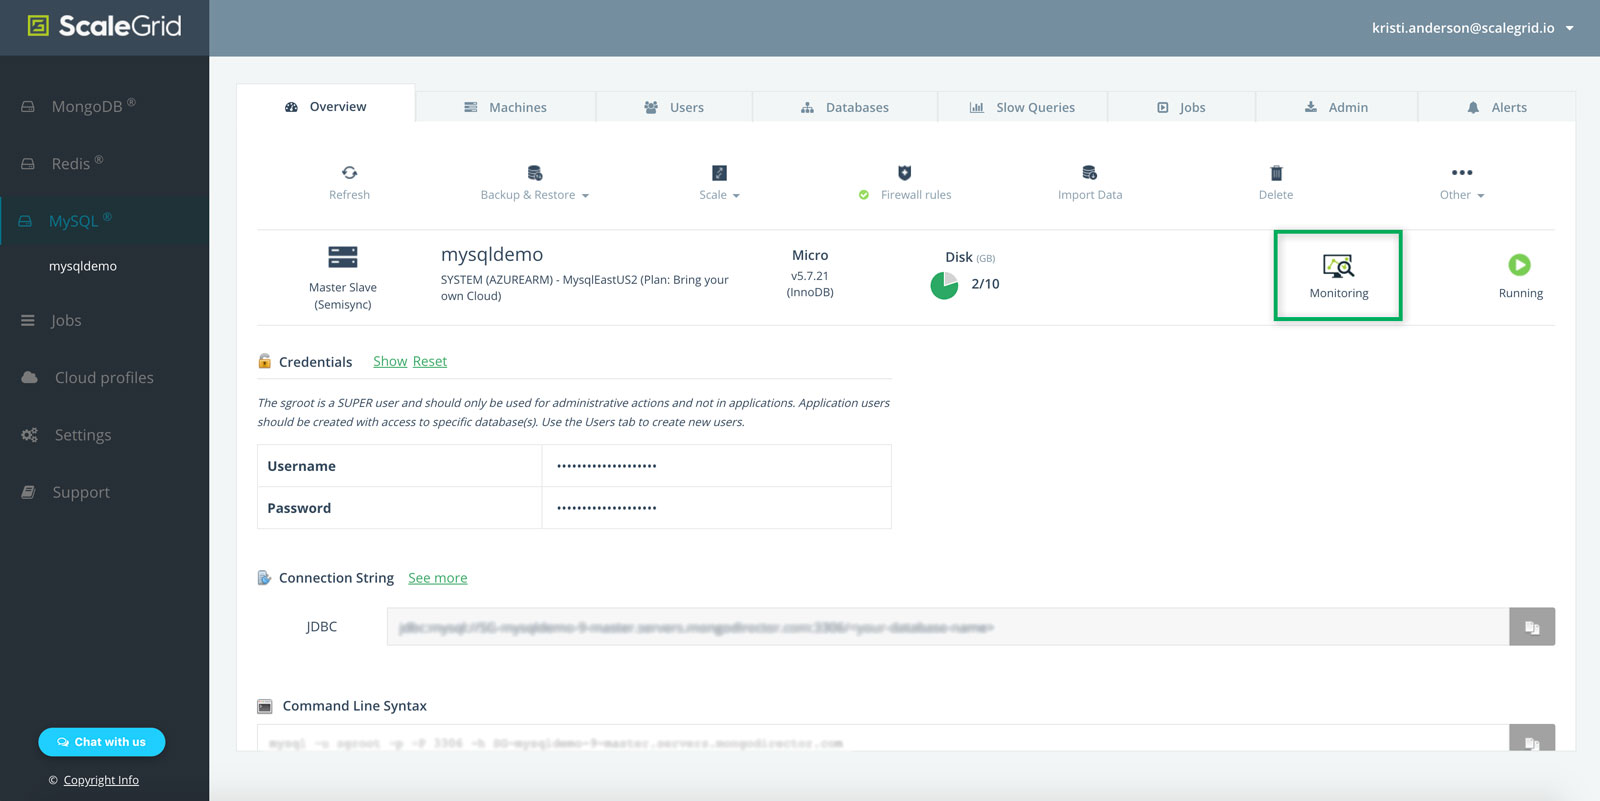
Click on your Monitoring icon to get started:
MySQL Hosting InnoDB Metrics
In this help doc, we're going to walk you through all of the MySQL metrics under the InnoDB tab of your Monitoring Console.
Find Your Other MySQL Deployment MetricsMySQL Overview Metrics
MySQL Operating System Metrics
MySQL Replication Metrics
At the top of your MySQL Monitoring Console, you can use the dropdown menus to change the view for your MySQL master vs. slave(s), time period, and time zone.
You can also click the green Compare Servers link to analyze how your master and slave(s) perform side-by-side for any given time range.
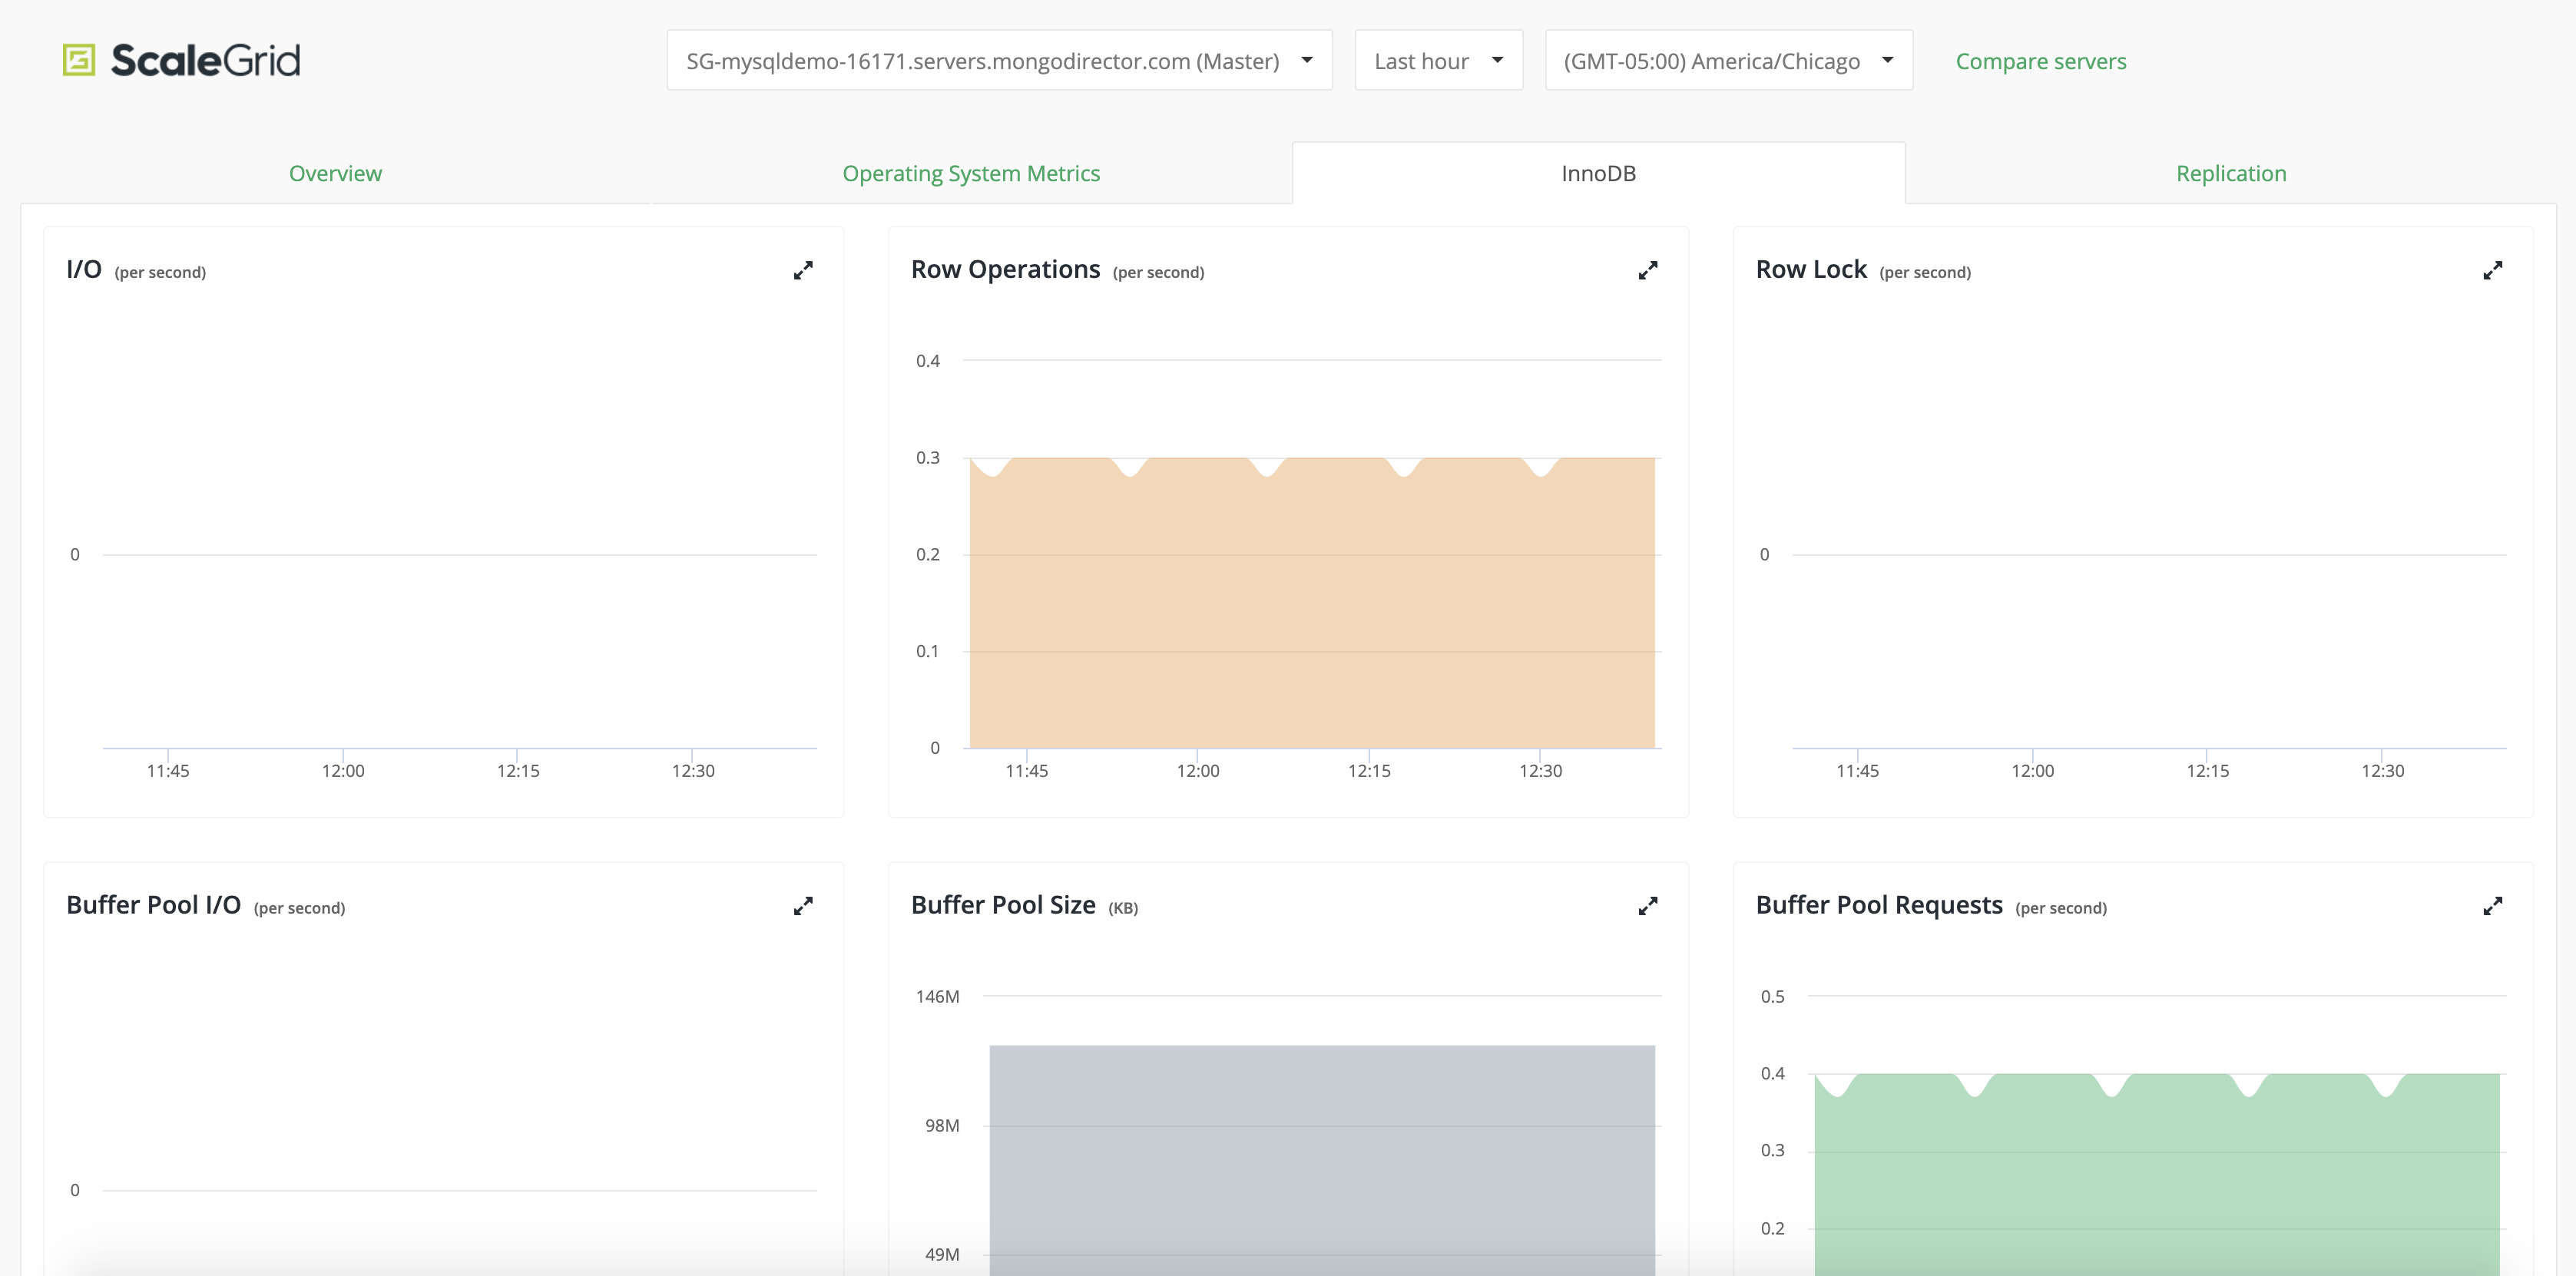
Chart AnnotationsSERVER ROLE CHANGE
Indicates that the role (Primary/Secondary/Master/Slave) of the Server instance changedSERVER RESTART
Indicates that the Server process restarted
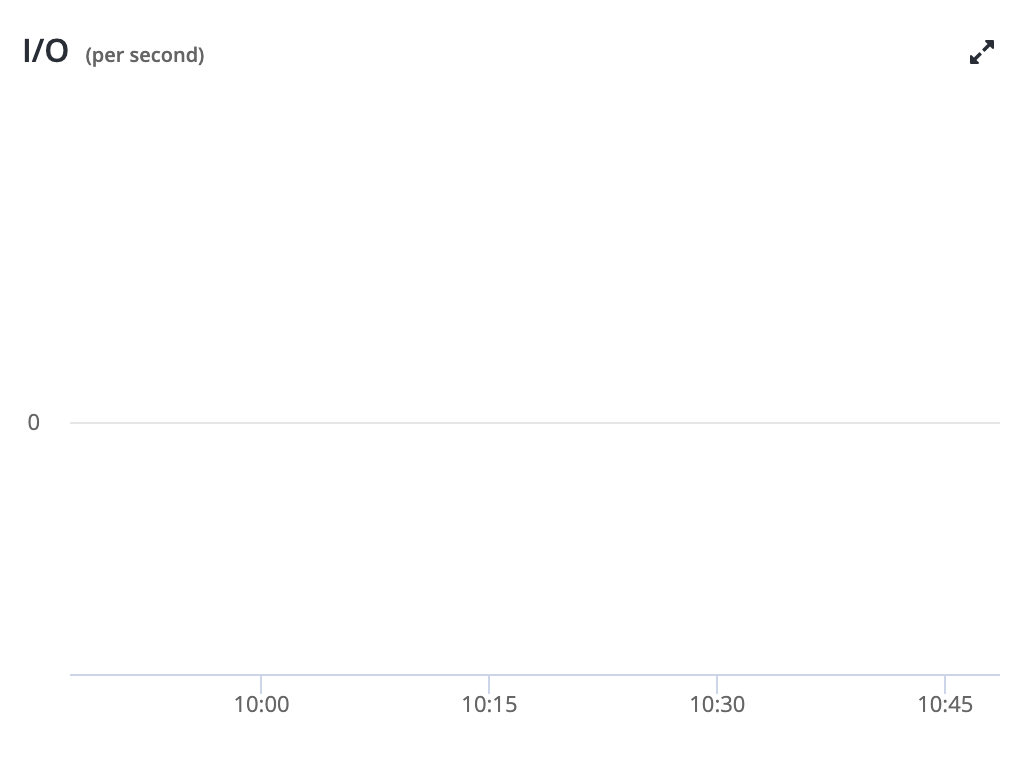
MySQL I/O
Analyze your MySQL I/O (per second):
- Data Read: Number of data reads(OS files)/sec (purple)
- Data Write: Number of data writes(OS files)/sec (green)
- Log Write: Number of physical writes to the InnoDB redo log file/sec (grey)
- Data Fsyncs: Number of fsync() operations/sec (orange)
Row Operations
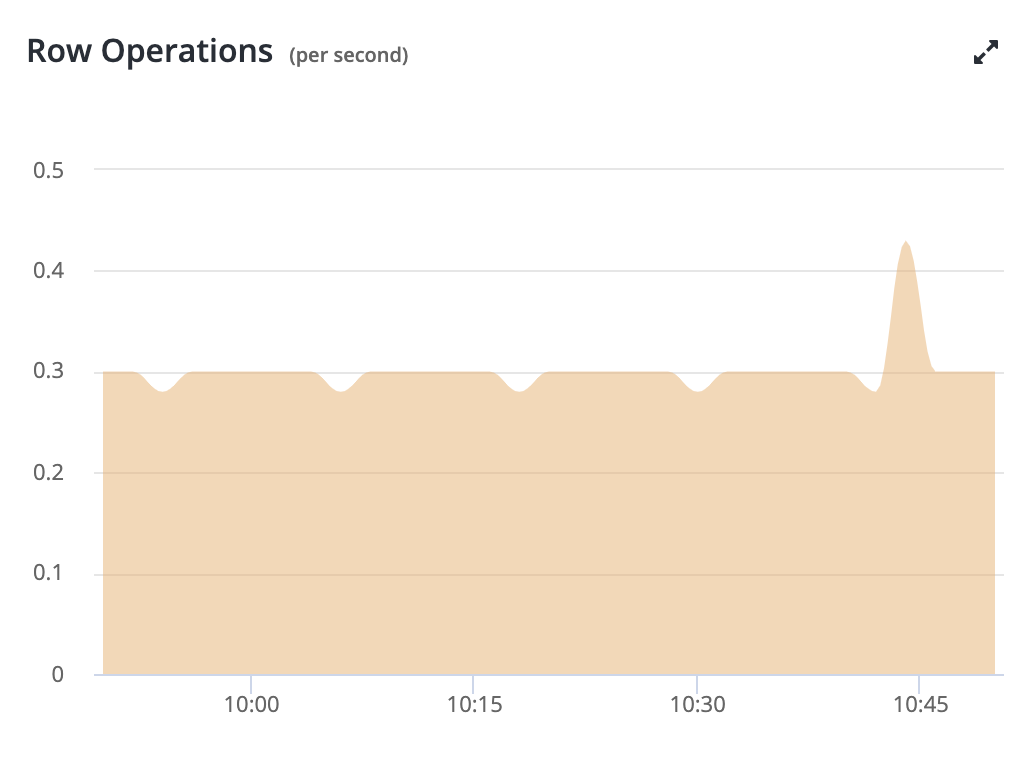
Analyze your MySQL Row Operations (per second):
- Updated: Number of rows updated in InnoDB tables (purple)
- Deleted: Number of rows deleted into InnoDB tables (green)
- Inserted: Number of rows inserted into InnoDB tables (grey)
- Read: Number of rows read from InnoDB tables (orange)
Row Lock
Analyze your MySQL Row Lock:
- Waited (per second): Number of times operations on tables had to wait for a row lock/sec (green)
- Wait Load: Number of row locks currently being waited for by operations on tables (purple)
Buffer Pool I/O
Analyze your MySQL Buffer Pool I/O (per second):
- Pages Written: Number of pages written by operations on InnoDB tables/sec (grey)
- Pages Read: Number of pages read from buffer pool by operations on tables/sec (orange)
- Pages Created: Number of pages created by operations on InnoDB tables/sec (green)
Buffer Pool Size
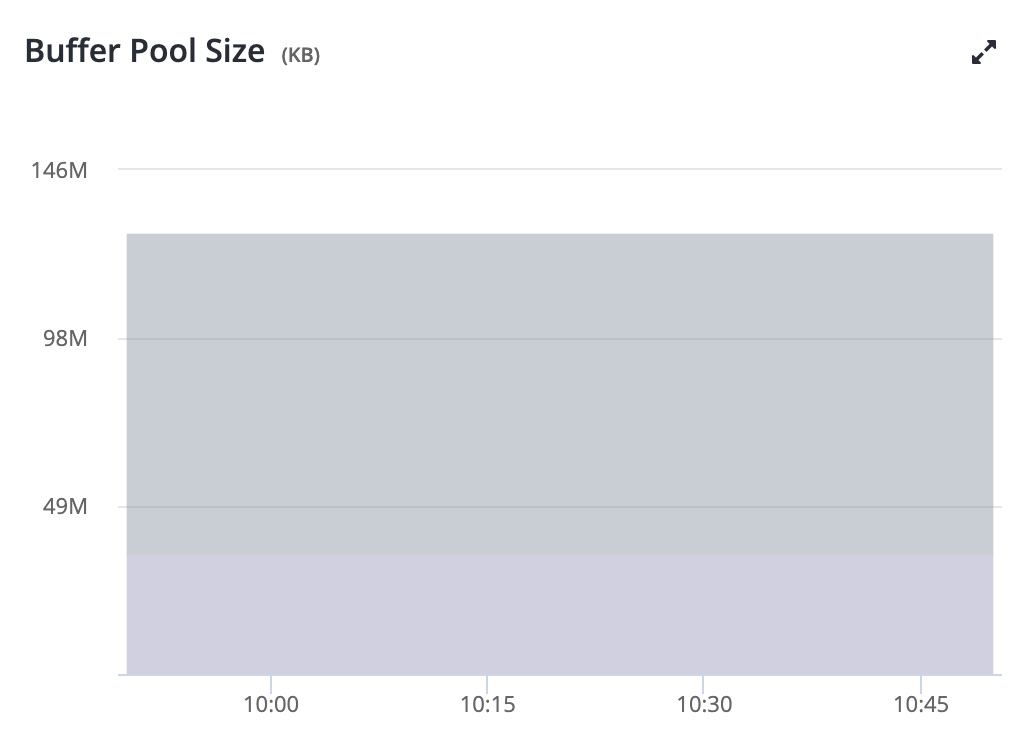
Analyze your MySQL Buffer Pool data size info by KB/sec:
- Data: Total number of KBs in the InnoDB buffer pool containing data - The number includes both dirty and clean pages (purple)
- Dirty: Total current number of KBs held in dirty pages in the InnoDB buffer pool (green)
- Free: Total size of free pages in the InnoDB buffer pool (grey)
- Misc: Total size of the InnoDB buffer pool that has been allocated for administrative overhead, such as row locks or the adaptive hash index (orange)
Buffer Pool Requests
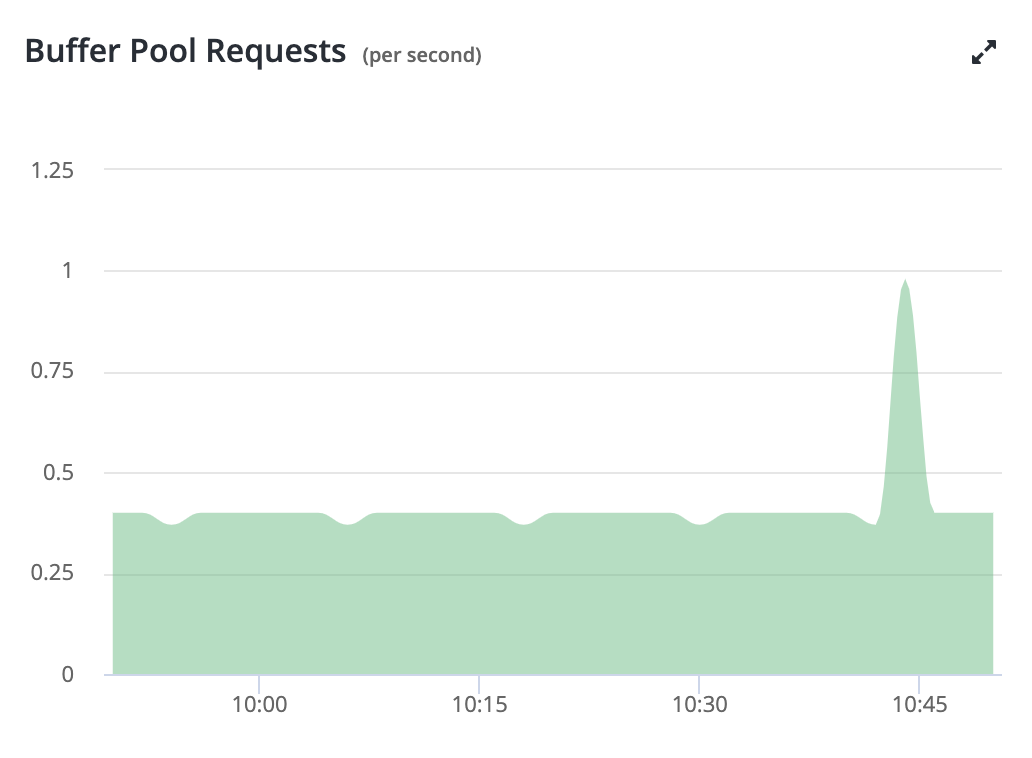
Analyze your MySQL Buffer Pool Requests (per second):
- Read: Number of logical read requests/sec (green)
- Write: Number of writes done to the InnoDB buffer pool/sec (purple)
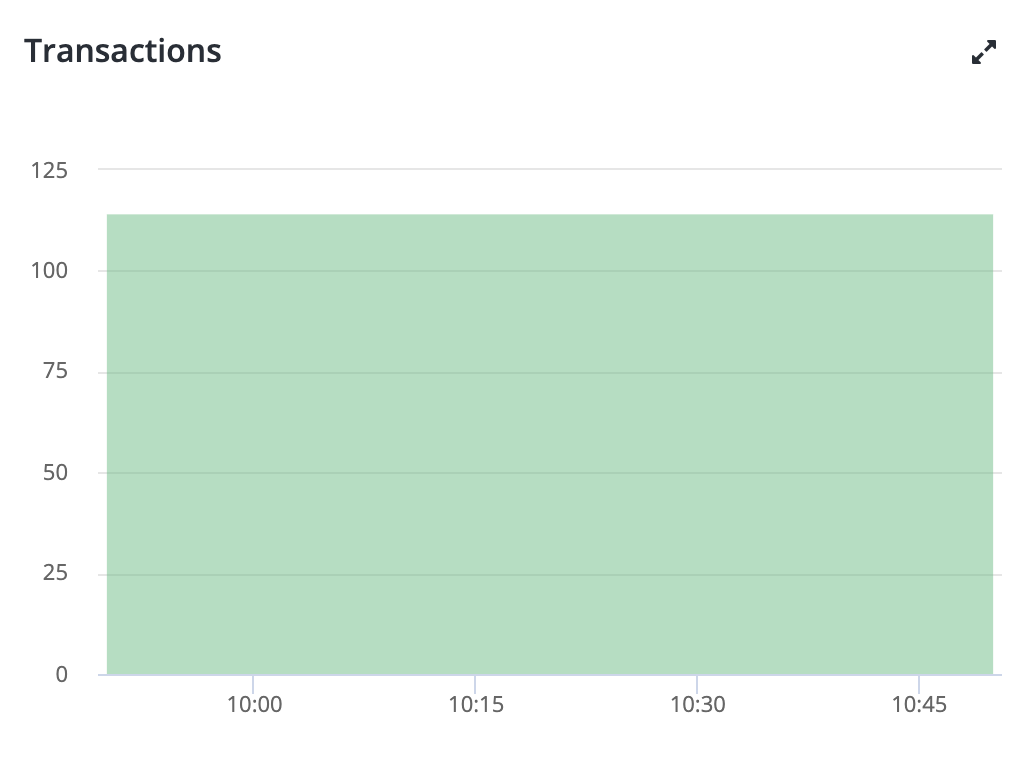
Transactions
Analyze your MySQL Transactions:
- History List Length: Length of undo logs
Log File Usage
Analyze your MySQL Log File Usage by rate of writes to InnoDB redo logs per hour:
- Log File Usage (KB/hour): Rate of writes to InnoDB redo logs per hour
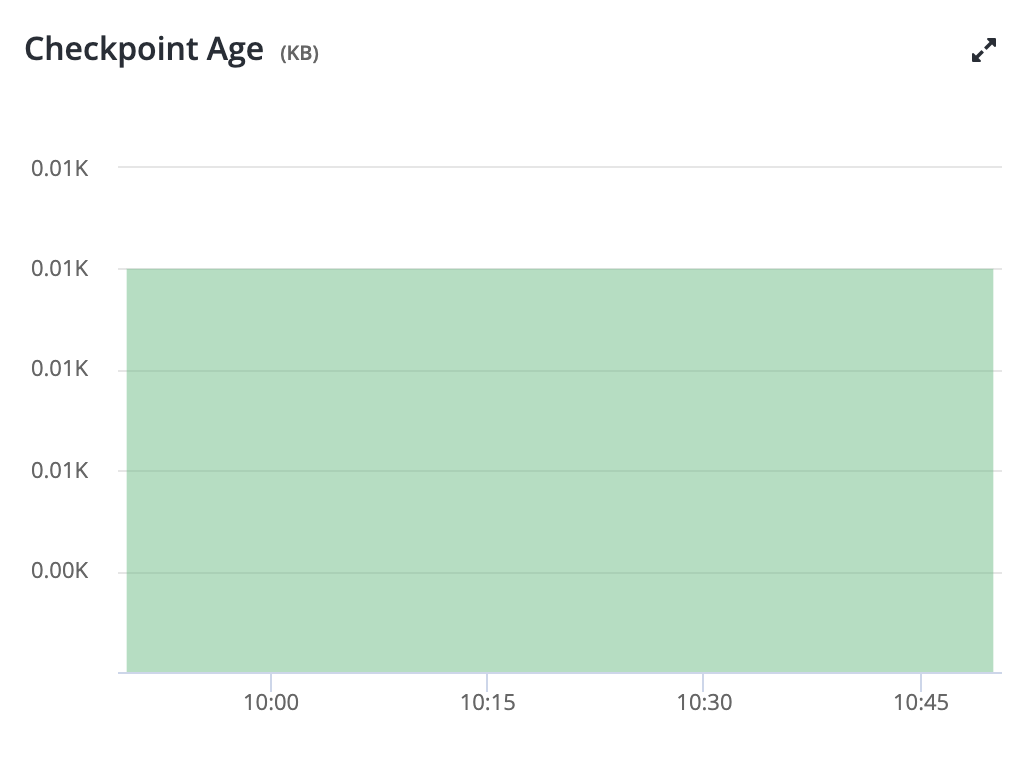
Checkpoint Age
Analyze your MySQL Checkpoint Age bytes in transaction logs since last checkpoint:
- Checkpoint Age (KB): KBs in transaction logs since last checkpoint
Change Buffer
Analyze your MySQL Change Buffer metrics (per second):
- Size: Number of rows in change buffer (purple)
- Merges: Number of merges/sec (blue)
- Merged Inserts: Number of merged inserts/sec (grey)
- Merged Deletes: Number of merged deletes/sec (orange)
- Merged Delete Marks: Number of merged delete marks/sec (green)
Change Buffer Activity
Analyze your MySQL Change Buffer Activity (per second):
- Merges: Number of merges/sec (purple)
- Merged Inserts: Number of merged inserts/sec (green)
- Merged Deletes: Number of merged deletes/sec (grey)
- Merged Delete Marks: Number of merged delete marks/sec (orange)
Updated 12 months ago
