Setup MongoDB® Oplog Tailing
Connect your MongoDB® deployments to 3rd party tools by setting up oplog tailing so they can read events from the MongoDB® oplog.
<script type="text/javascript" id="hs-script-loader" async defer src="//js.hs-scripts.com/3848622.js"></script>The MongoDB oplog, or operations log, is a special capped collection that keeps a rolling record of all operations that modify the data stored in your database.
At ScaleGrid, we support oplog tailing for our hosting for MongoDB® plans which allows you to get the operations that are to be replicated. This is also commonly used for tying into 3rd party tools so they can read events from the MongoDB® oplog. You can also leverage it in your programming model so your application server is notified in real-time of any changes happening to your entire database.
Create a MongoDB® User for Oplog Tailing
Once you have your new MongoDB® cluster is up and running, you can create a new user for oplog tailing:
- Log in to the ScaleGrid console.
- Go to your MongoDB® page, and click into your primary cluster.
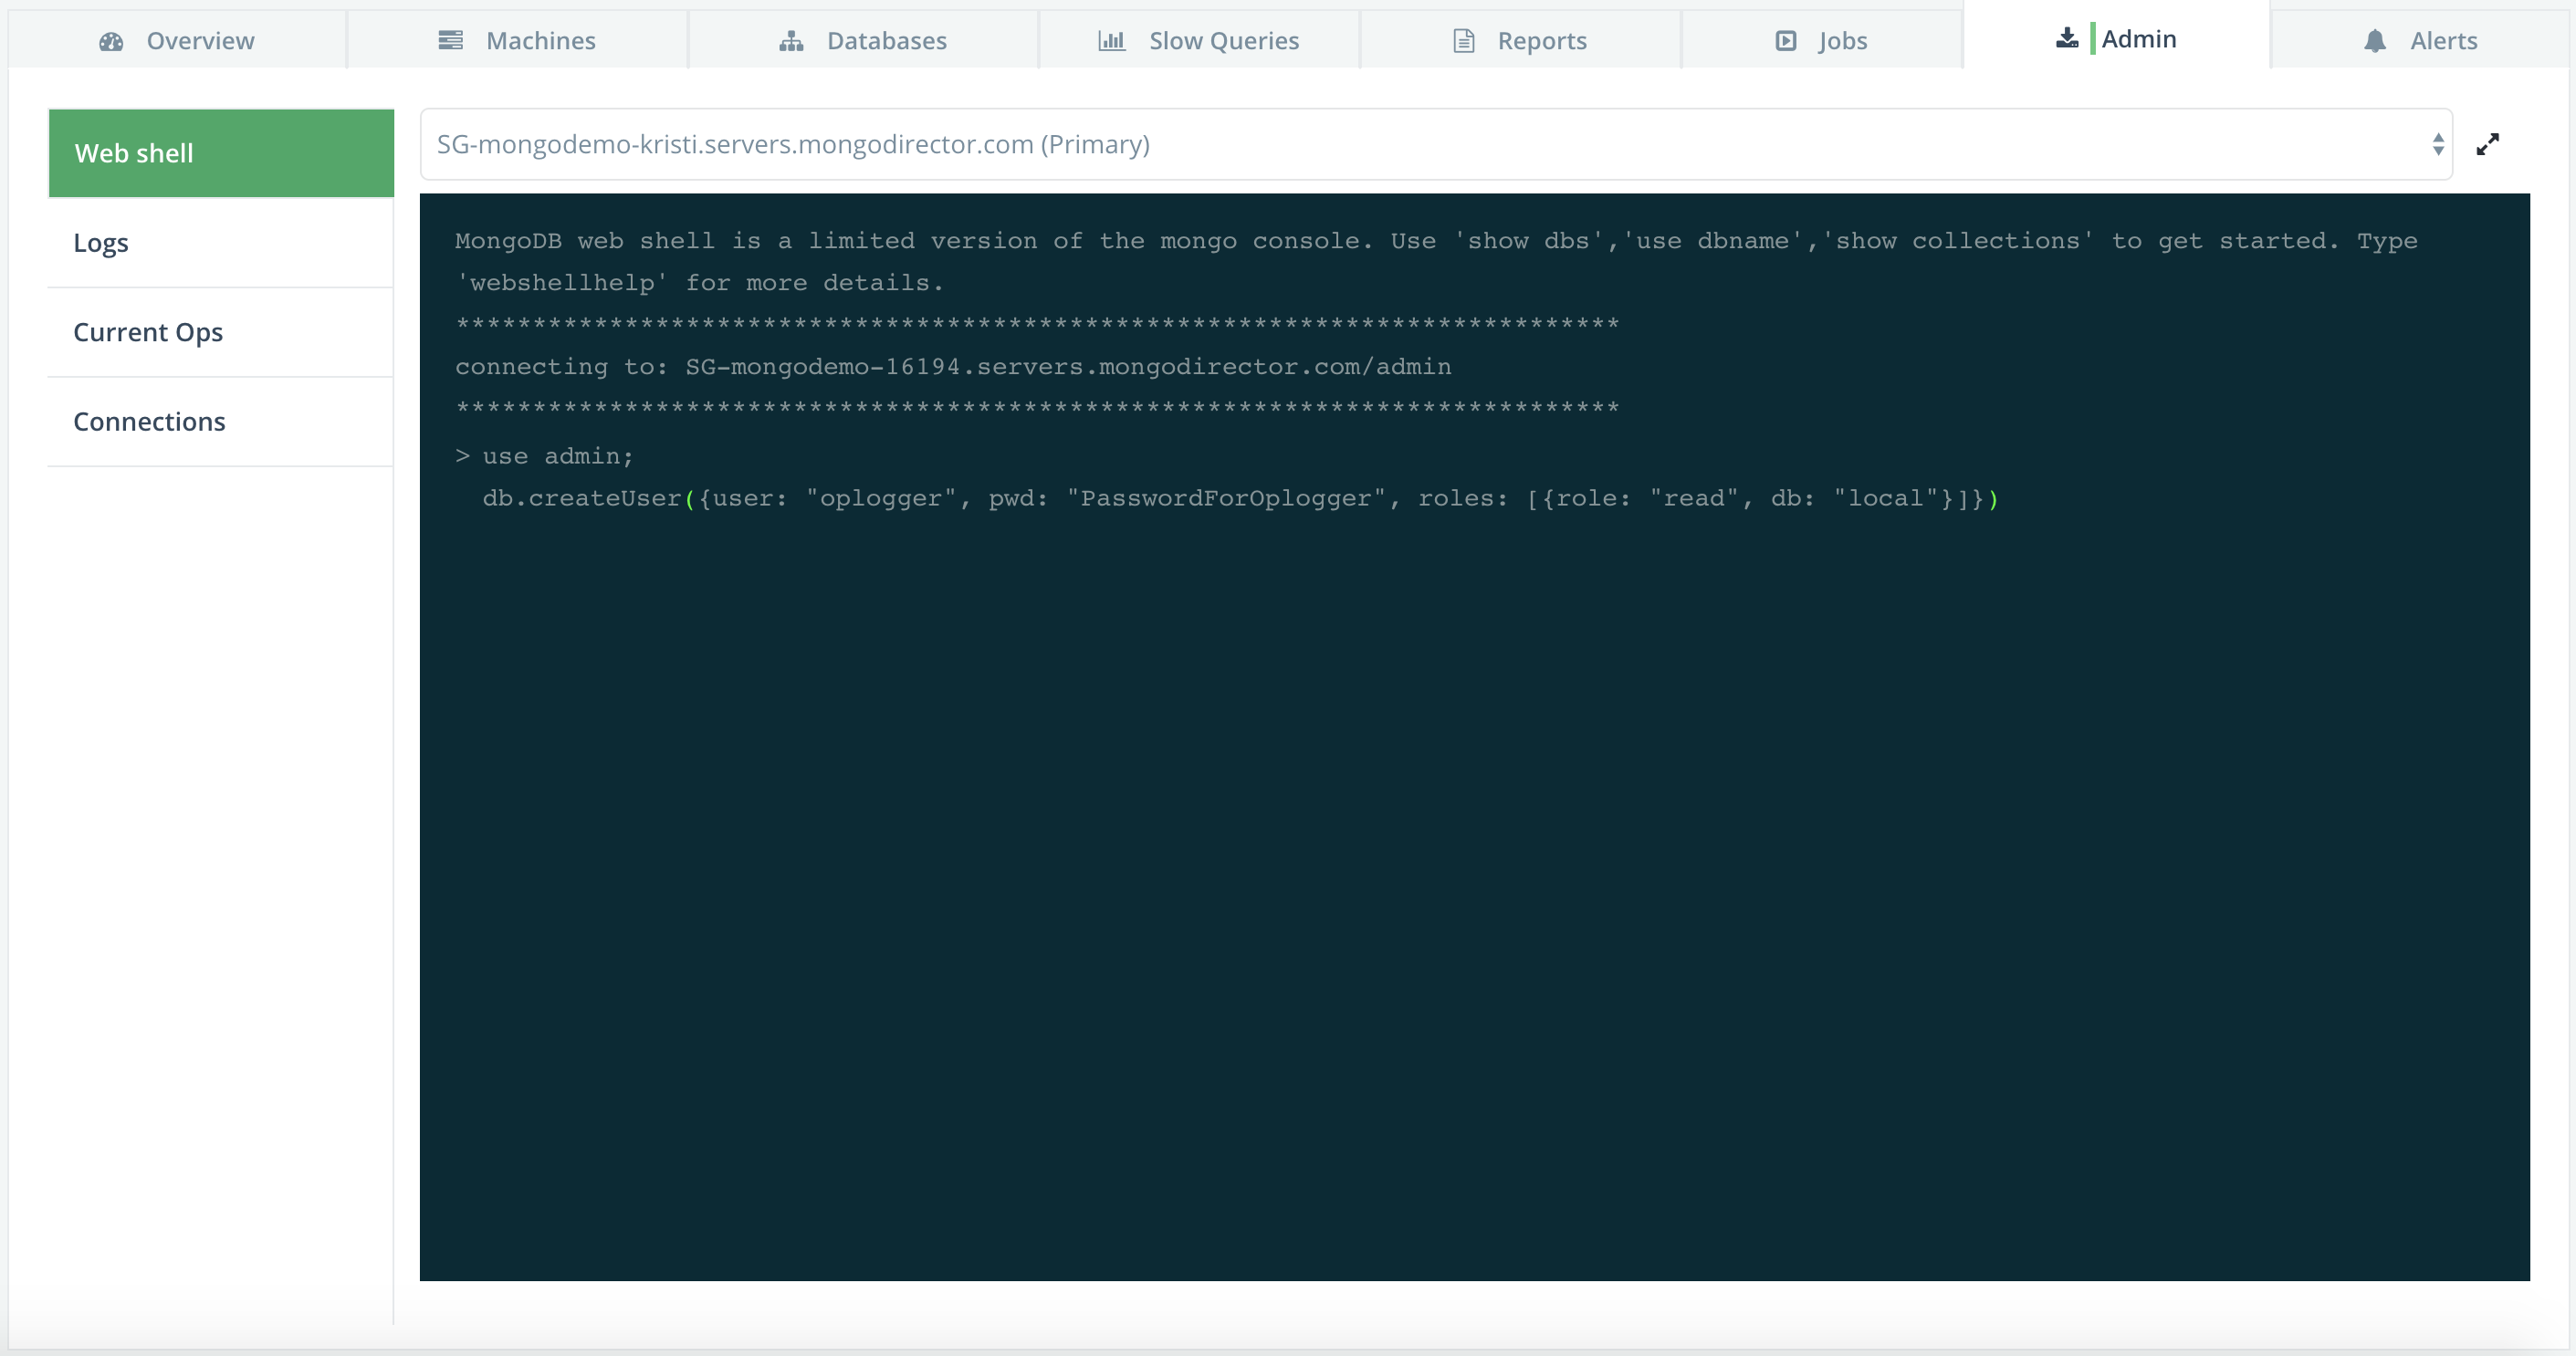
- Click on the Admin tab to open up your MongoDB® Web Shell.
- Enter the below command into the blue Web Shell box:
use admin; |
- Click enter, and your MongoDB® user for oplog tailing will now be created.

You can also create the user by running this from the MongoDB command line.
Connect to the MongoDB® Oplog
In order to connect to the oplog, you need to make sure your connection string's authSource is for the admin database you just created your oplog user on but pointing to the local database where the oplog resides.
We used the following credentials for our new oplog user:
Name: oplogger
Password: PasswordForOplogger
So, we must update our Connection String to look like this:
| mongodb://oplogger:PasswordForOplogger@mongo-server-1.example.com,mongo-server-2.example.com,mongo-server-3.example.com/local?authSource=admin&replicaSet=replicaSetName |
You can find your MongoDB® Connection String under the Overview tab of your MongoDB® cluster details page.
For more detailed steps, check out this Meteor GitHub Post.
Your MongoDB® plan data size is measured only for your custom databases - system databases like oplog are not used to compute the size.
Updated 12 months ago
