MySQL Operating System Metrics
Analyze your MySQL hosting operating system metrics with ScaleGrid DBaaS, including CPU usage, system memory, and disk usage.
ScaleGrid MySQL hosting and database management solutions come with advanced monitoring metrics to help ensure the continuous health of your deployments. Each cluster comes with it's own unique MySQL Monitoring Console found on your cluster details page.
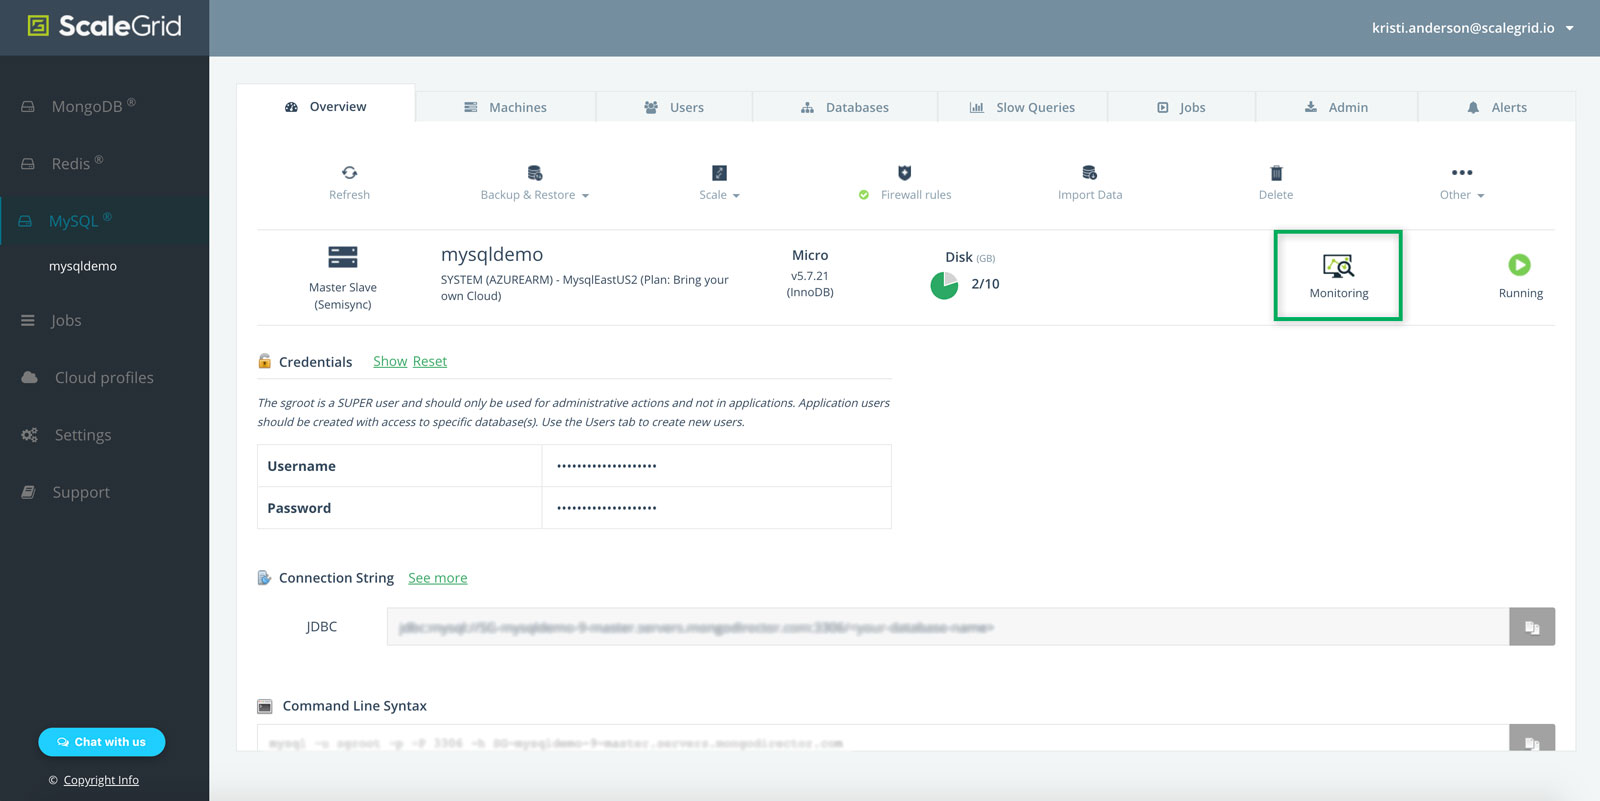
Click on your Monitoring icon to get started:
MySQL Hosting Operating System Metrics
In this help doc, we're going to walk you through all of the MySQL metrics under the Operating System Metrics tab of your Monitoring Console.
Find Your Other MySQL Deployment MetricsMySQL Overview Metrics
MySQL InnoDB Metrics
MySQL Replication Metrics
At the top of your MySQL Monitoring Console, you can use the dropdown menus to change the view for your MySQL master vs. slave(s), time period, and time zone.
You can also click the green Compare Servers link to analyze how your master and slave(s) perform side-by-side for any given time range.
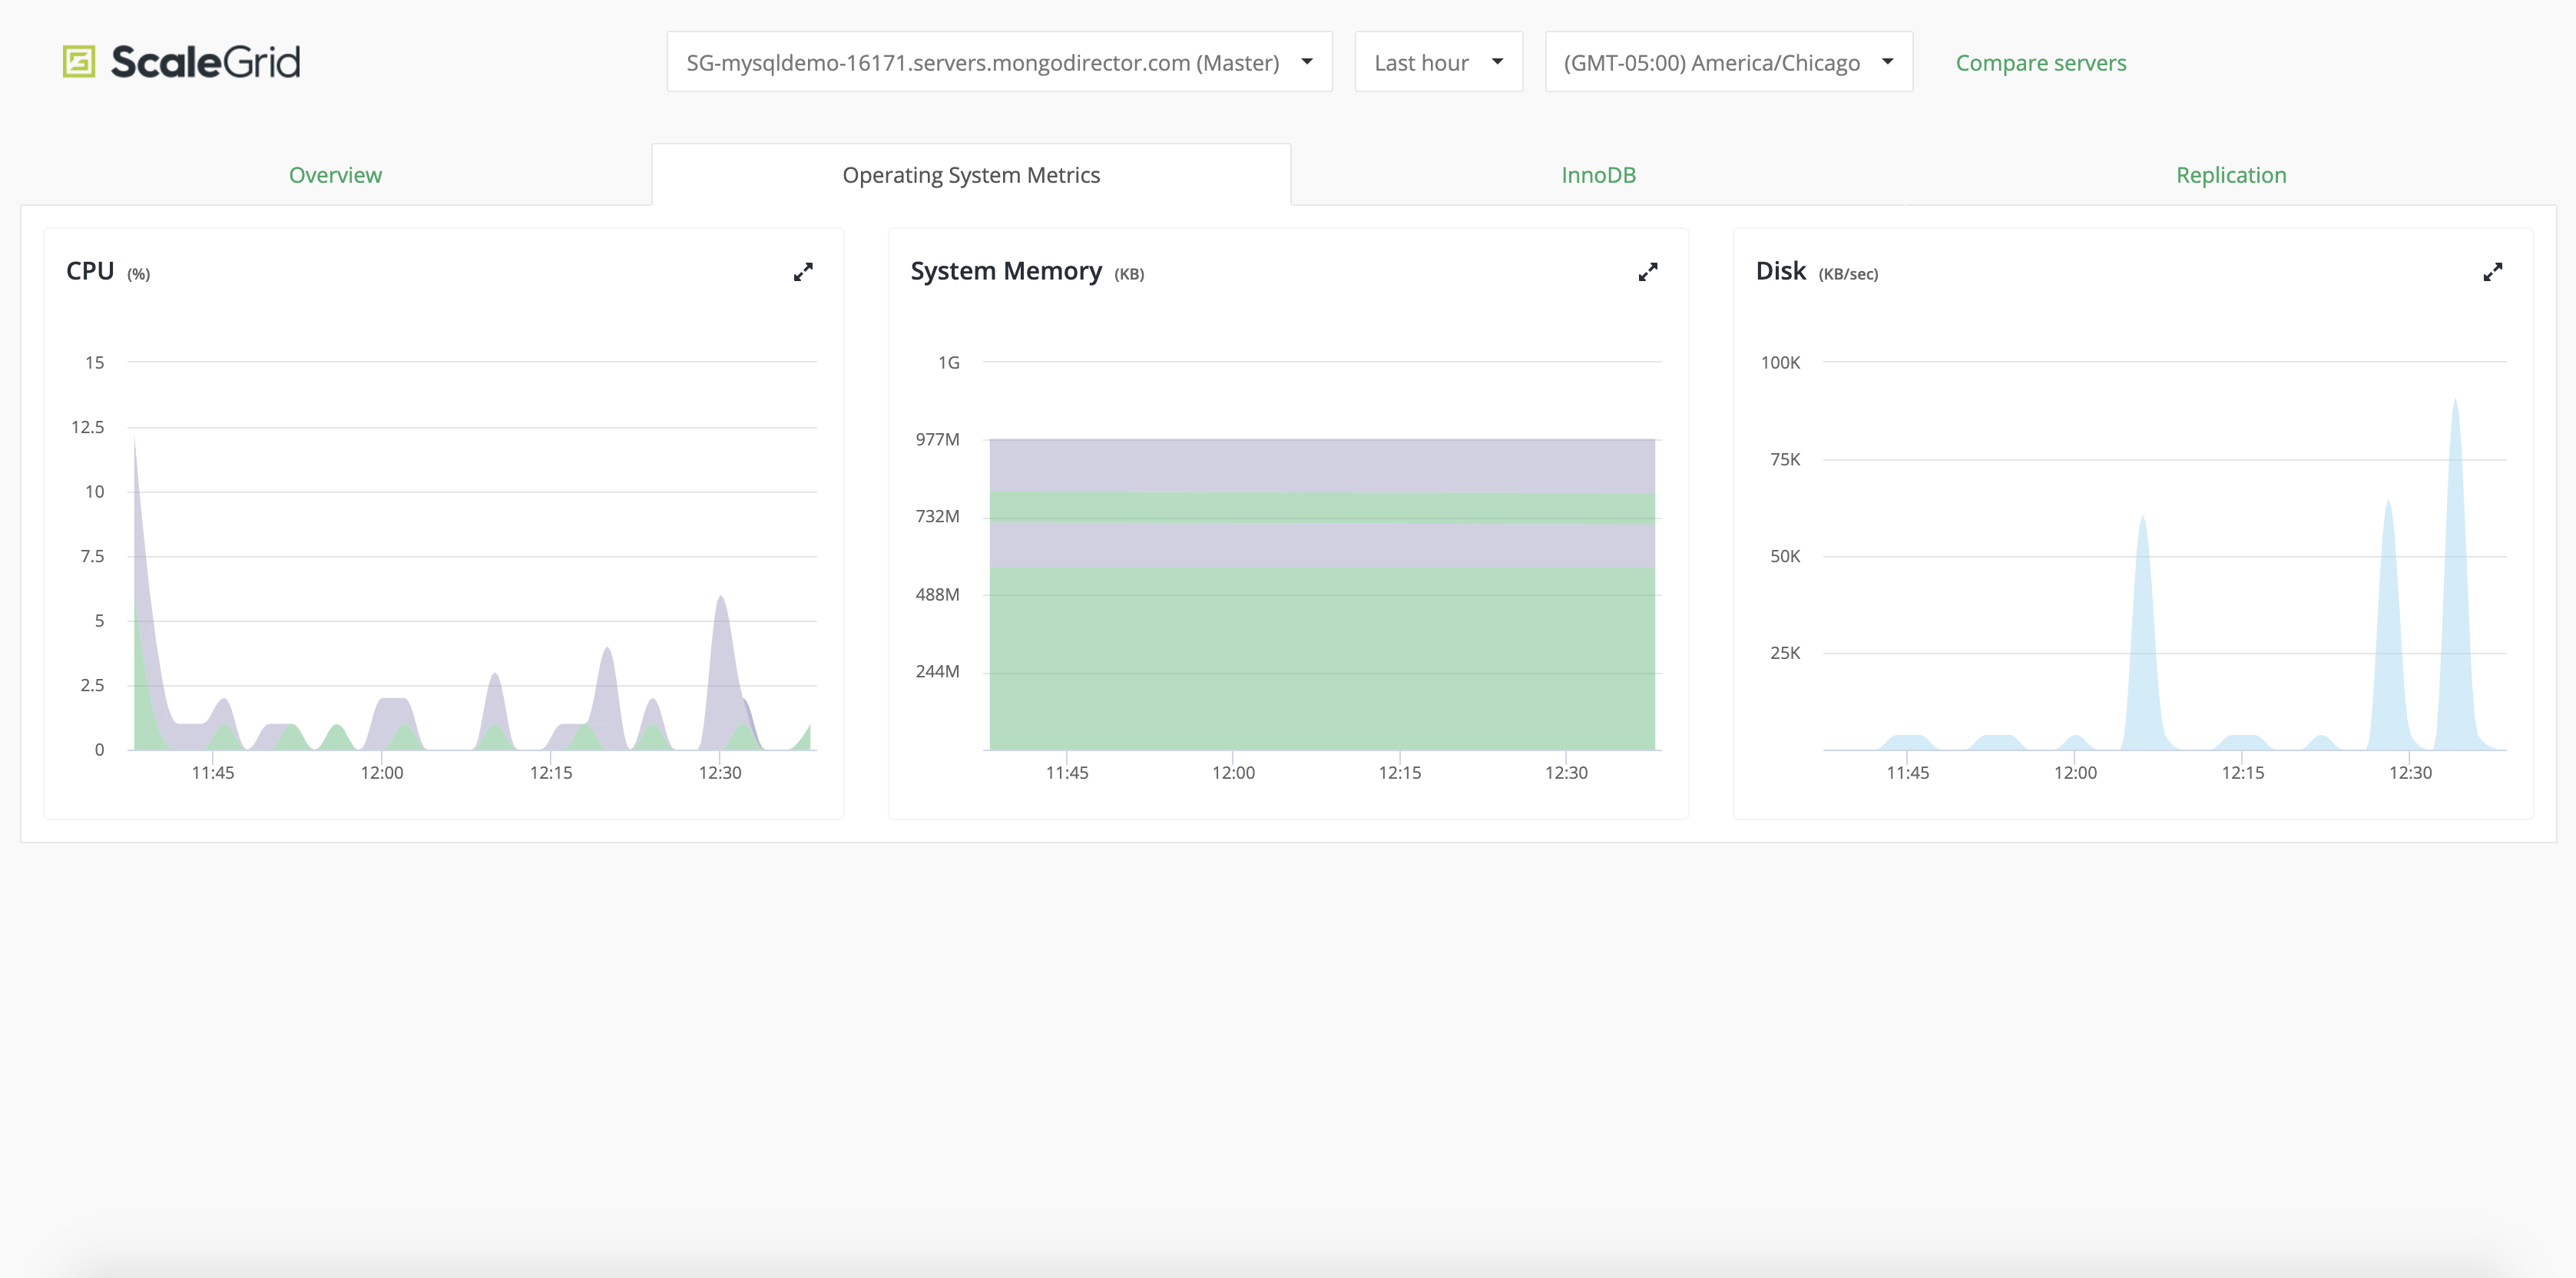
Chart AnnotationsSERVER ROLE CHANGE
Indicates that the role (Primary/Secondary/Master/Slave) of the Server instance changedSERVER RESTART
Indicates that the Server process restarted
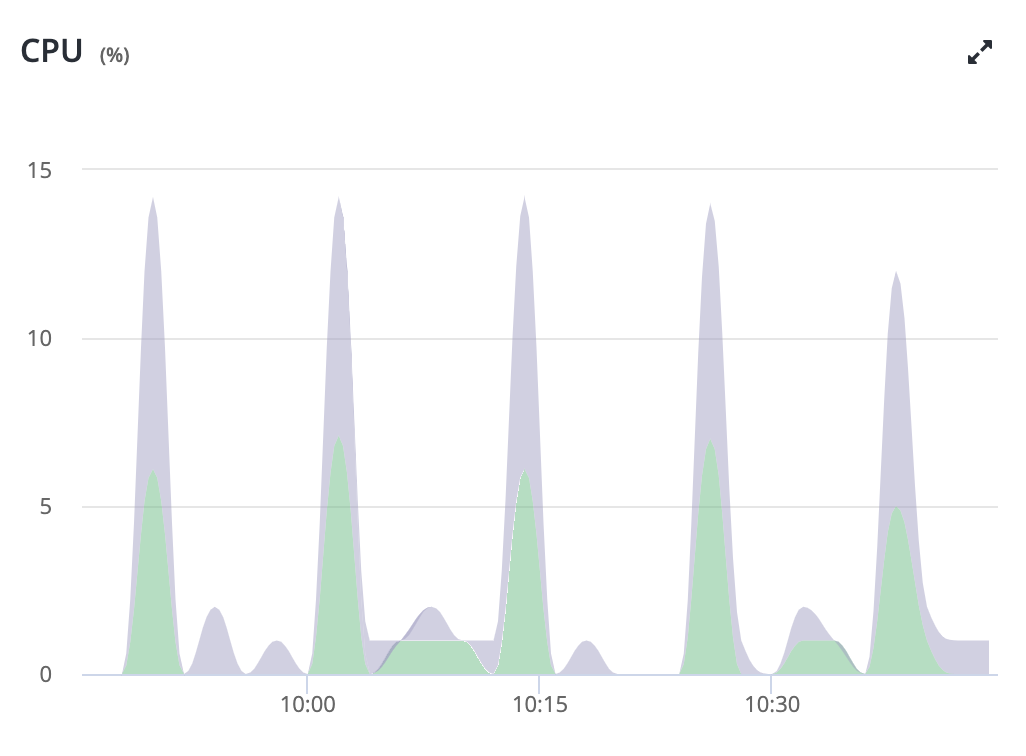
MySQL CPU (%)
Analyze your MySQL CPU usage:
- USER: The percentage of time the CPU spent in user applications (green)
- SYSTEM: The percentage of time the CPU spent in the operating system (purple)
- NICE: The percentage of time the CPU spent in nice mode (green)
- IOWAIT: The percentage of time the CPU spent waiting for IO operations to complete (purple)
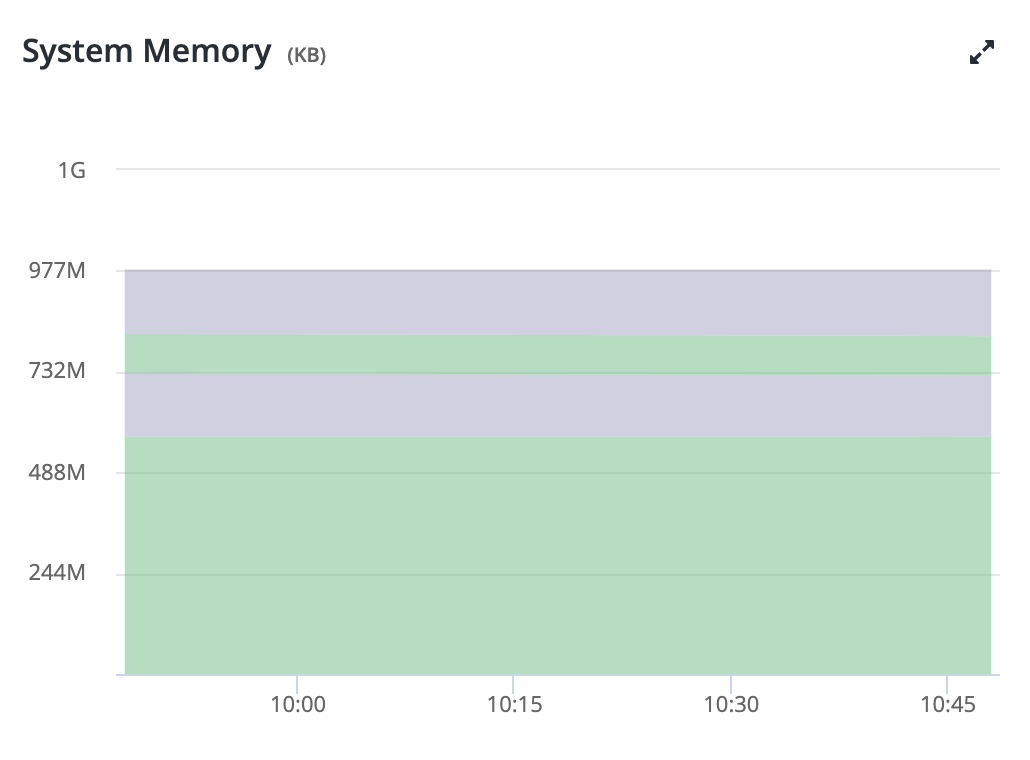
MySQL System Memory
MySQL System Memory (RAM) usage:
- USED (KB): Used memory (green)
- FREE (KB): Free memory (purple)
- BUFFERS (KB): Memory used for buffers (green)
- CACHED (KB): Memory used for page cache (purple)
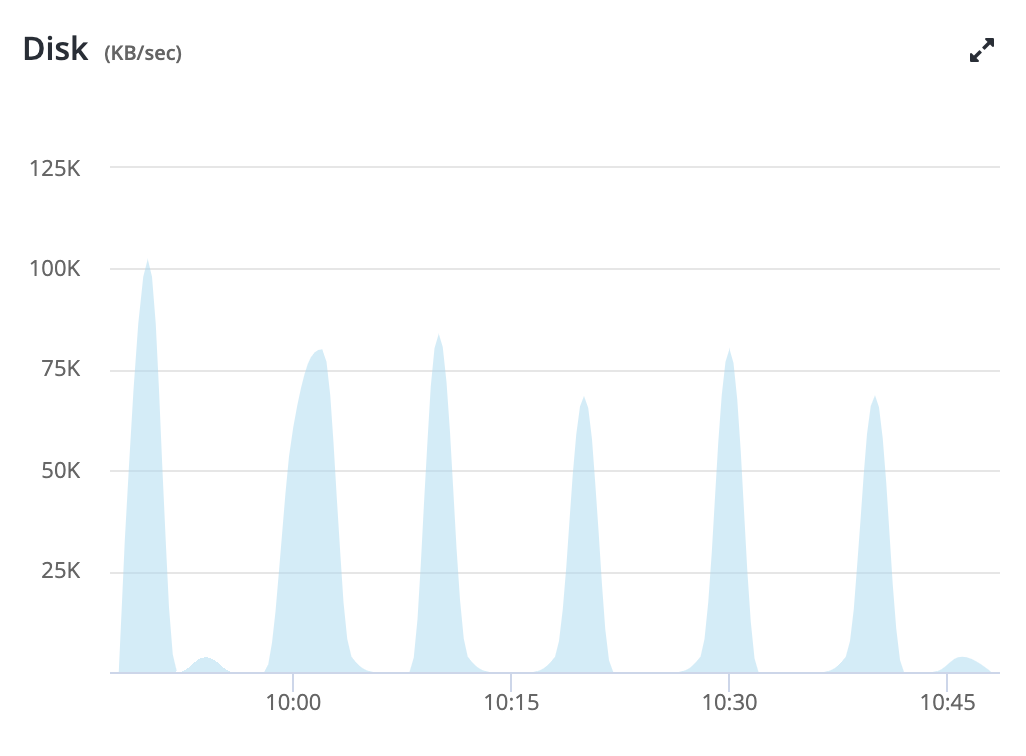
MySQL Disk Usage
Analyze your MySQL Disk usage:
- READ (KB/sec): Total disk reads/sec (purple)
- WRITE (KB/sec): Total disk writes/sec (blue)
Updated 11 months ago
