PostgreSQL Activity Stats
Fully managed PostgreSQL hosting at ScaleGrid provides Activity Stats for your PostgreSQL cluster deployment. Activity Stats include all of the important metrics you need to know about your PostgreSQL server.
Find Your PostgreSQL Activity Stats
- Log into the ScaleGrid console.
- Go to your PostgreSQL cluster details page.
- Click on the Activity Stats tab at the top.
- Review your PostgreSQL activity metrics!
By default, your Activity Stats presents data for all of your PostgreSQL databases. You can customize which database to view stats for from the dropdown list at the top, and select whether to show table data.
Click the Refresh button in the upper right to refresh your data, and download your Activity Stats report through the Download PDF button.
Activity Stats
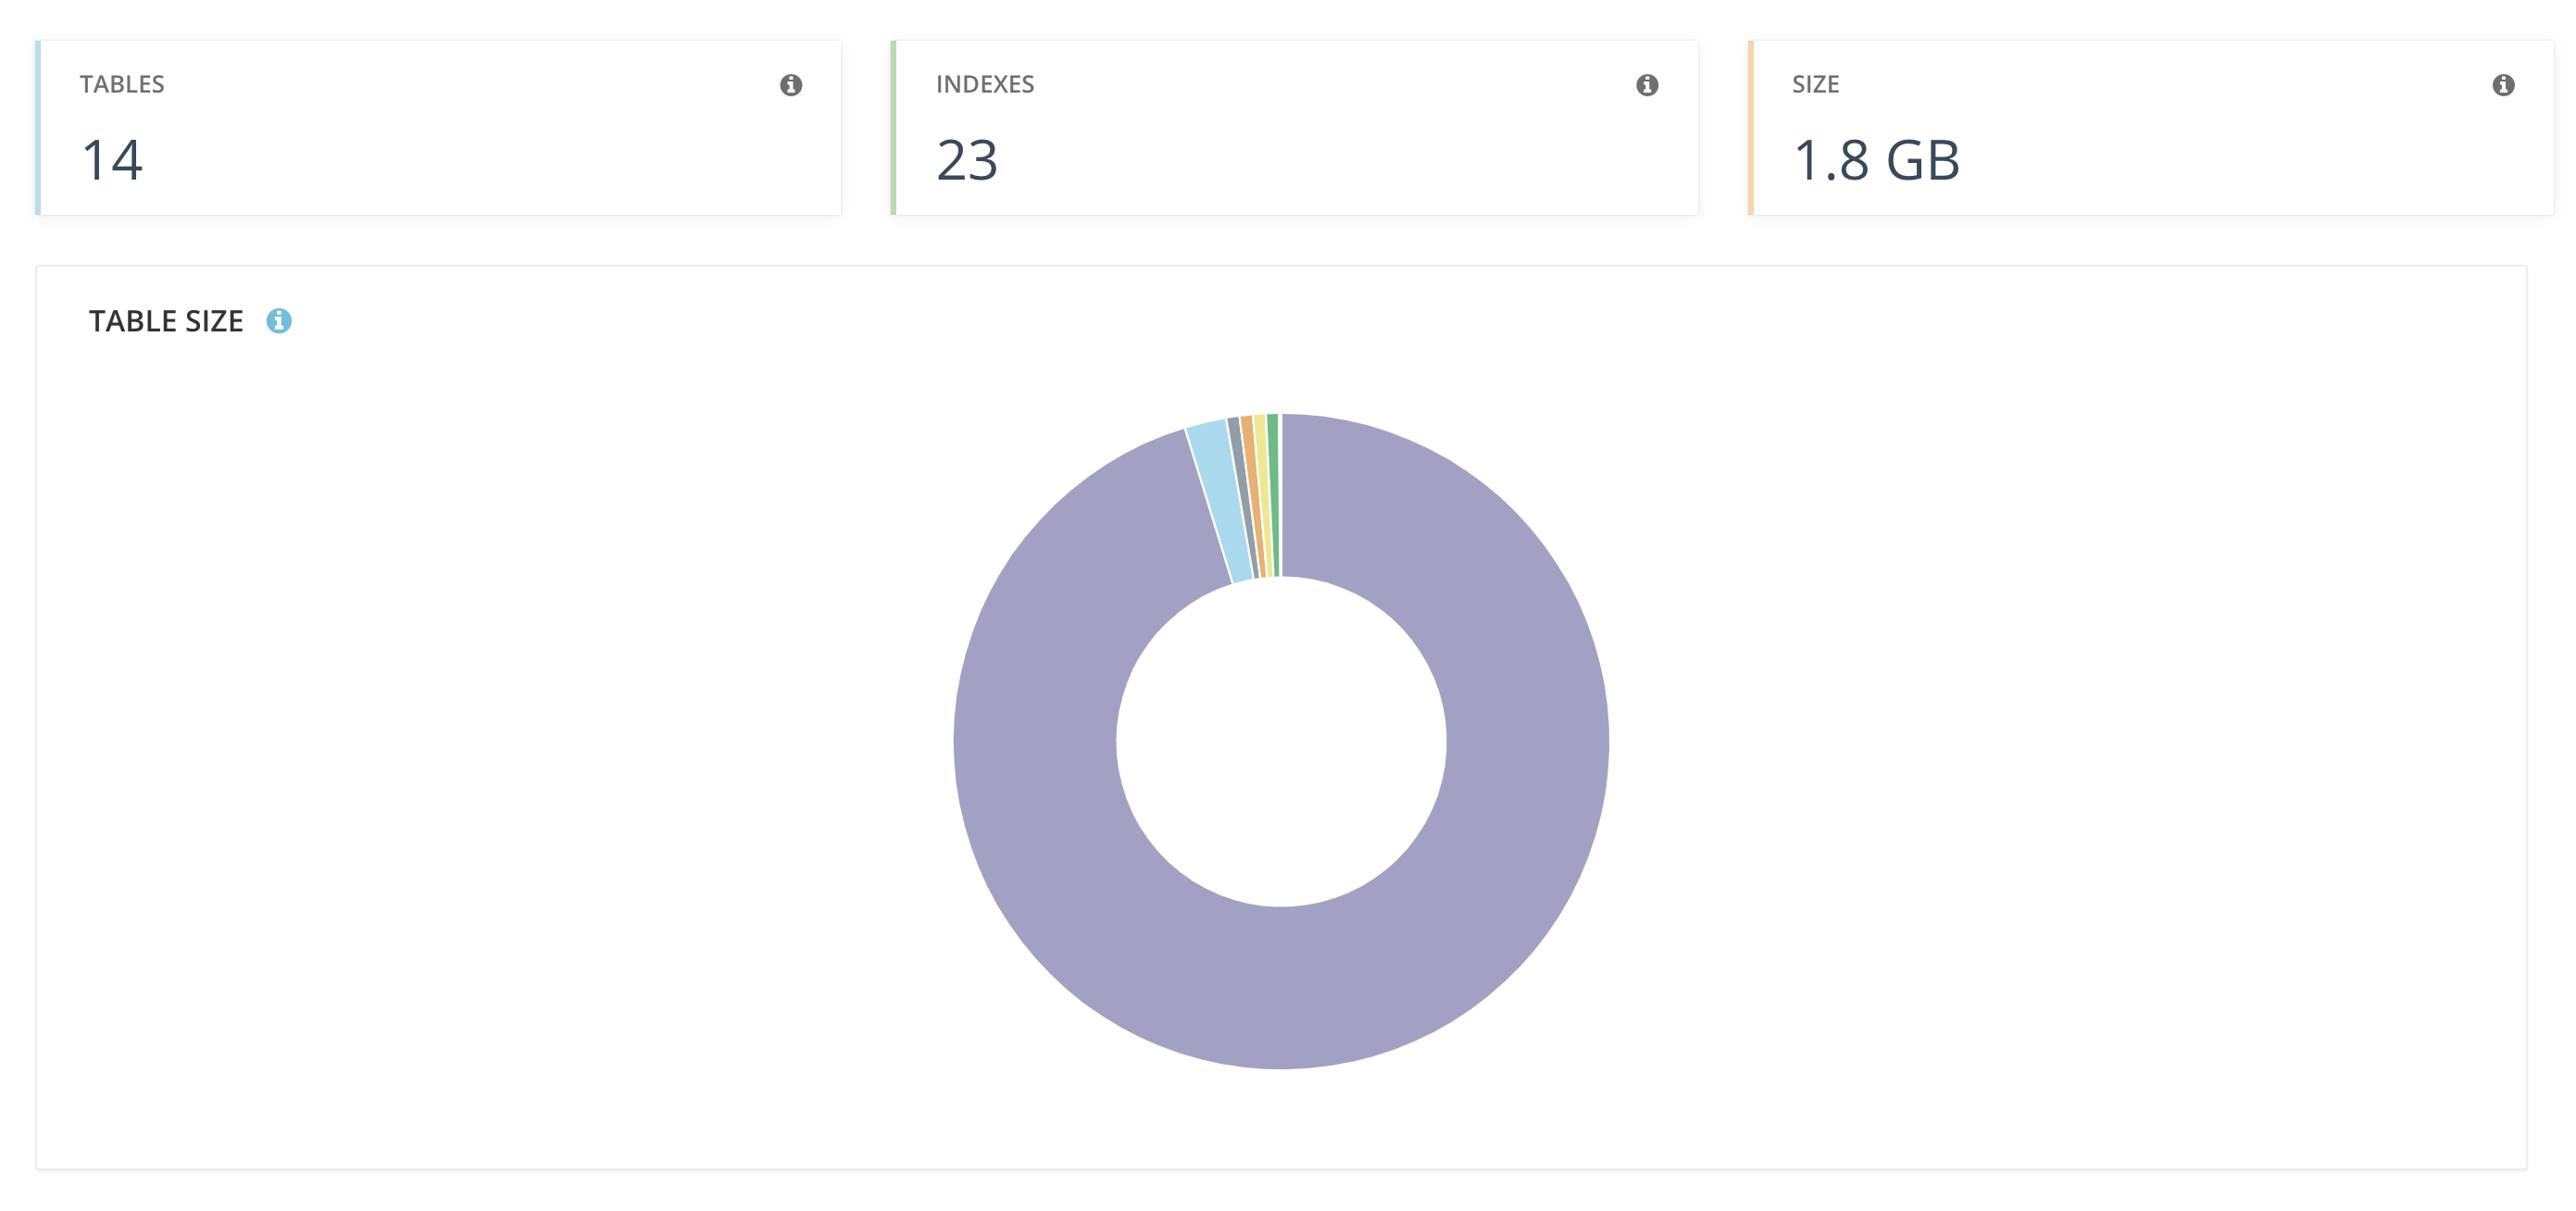
PostgreSQL Tables
Total number of tables.
PostgreSQL Indexes
Total number of indexes.
PostgreSQL Size
Size of database on disk.
Table Size
Largest PostgreSQL tables by size on disk.
Index Size
Largest indices by size on disk.

Dead Rows
Tables in this deployment with most dead rows. Higher number of dead rows can impact performance, and indicate bloated tables.
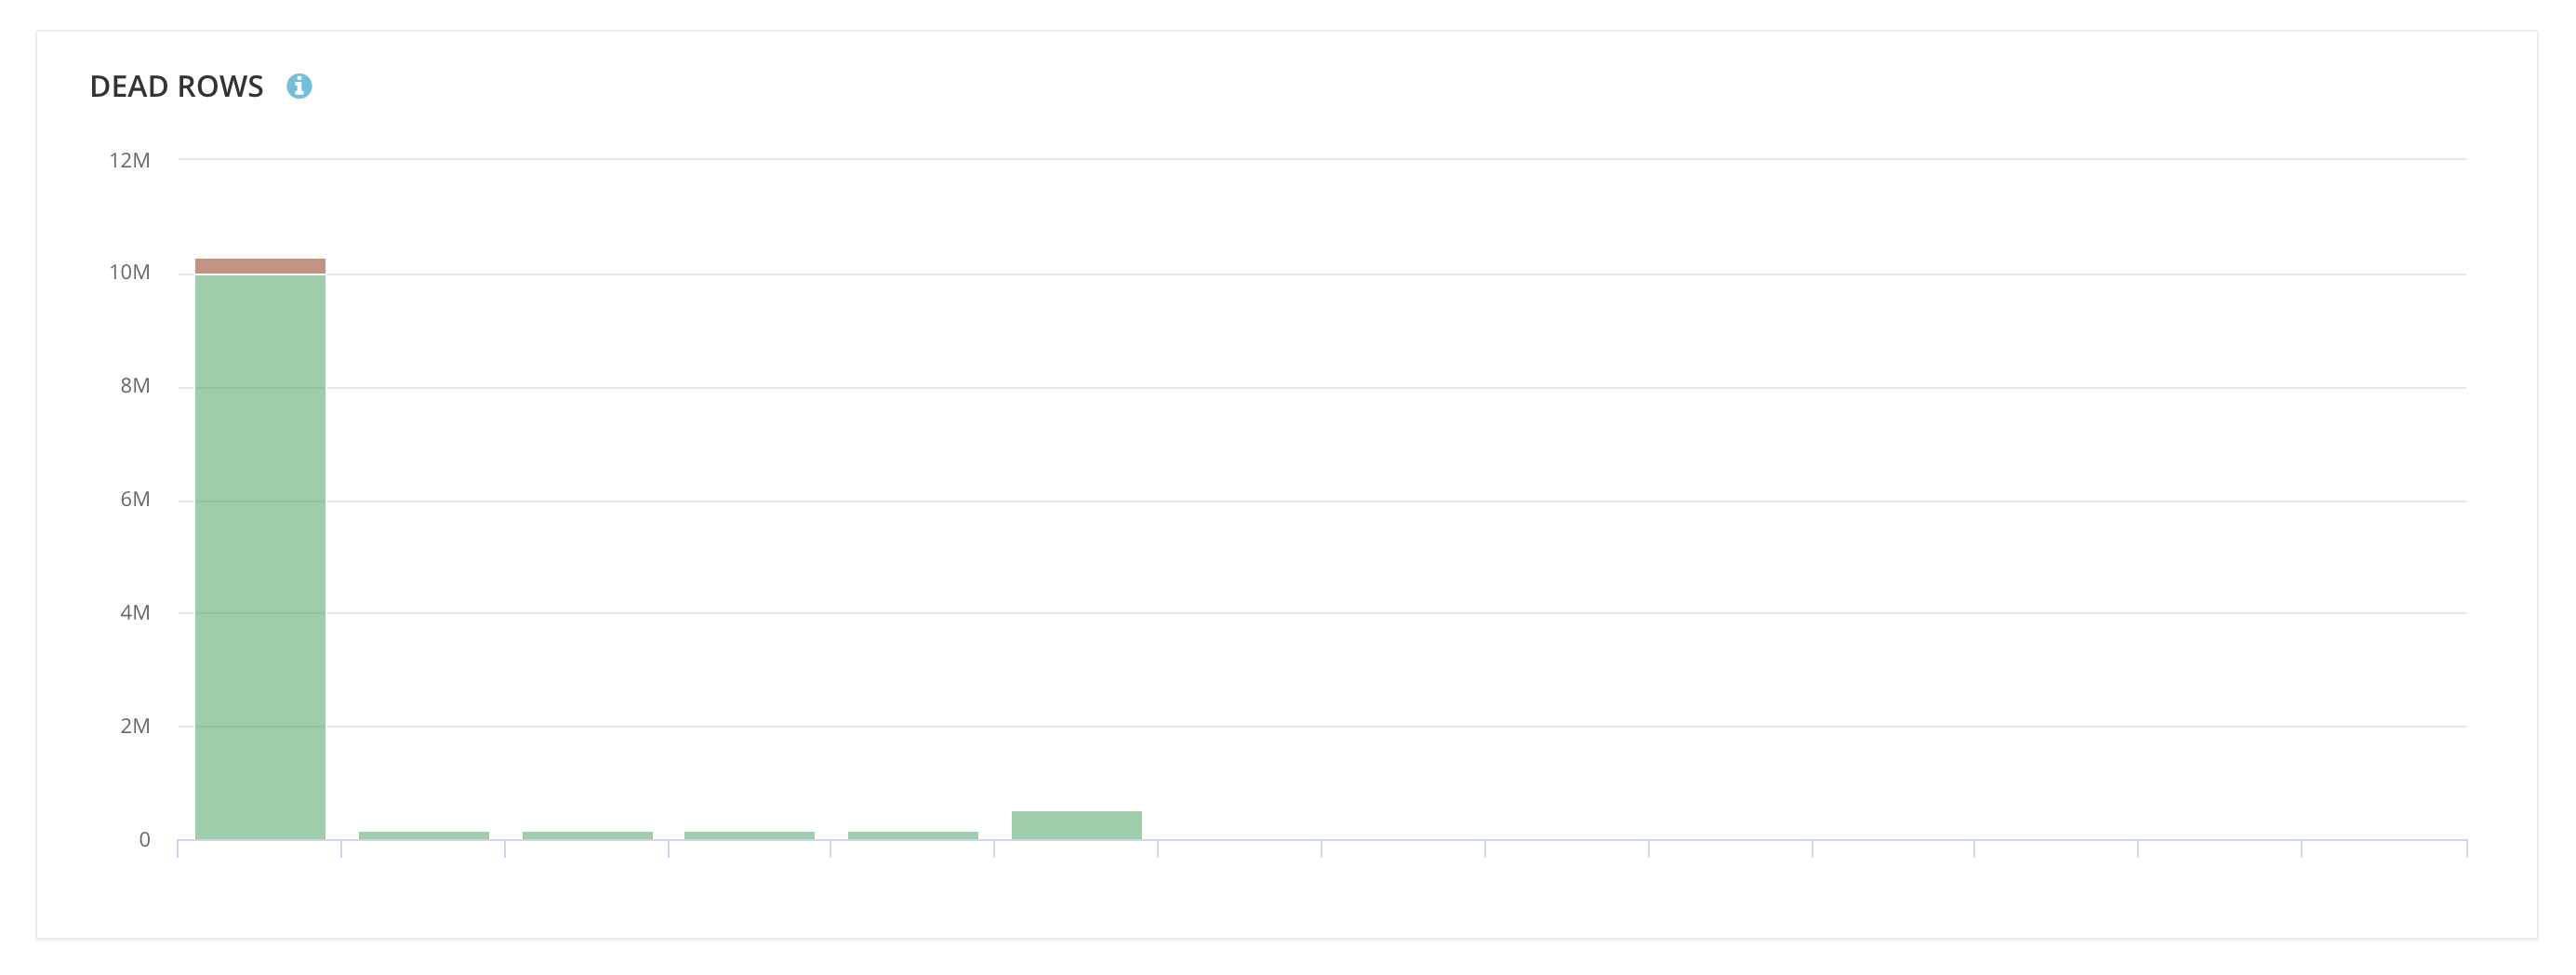
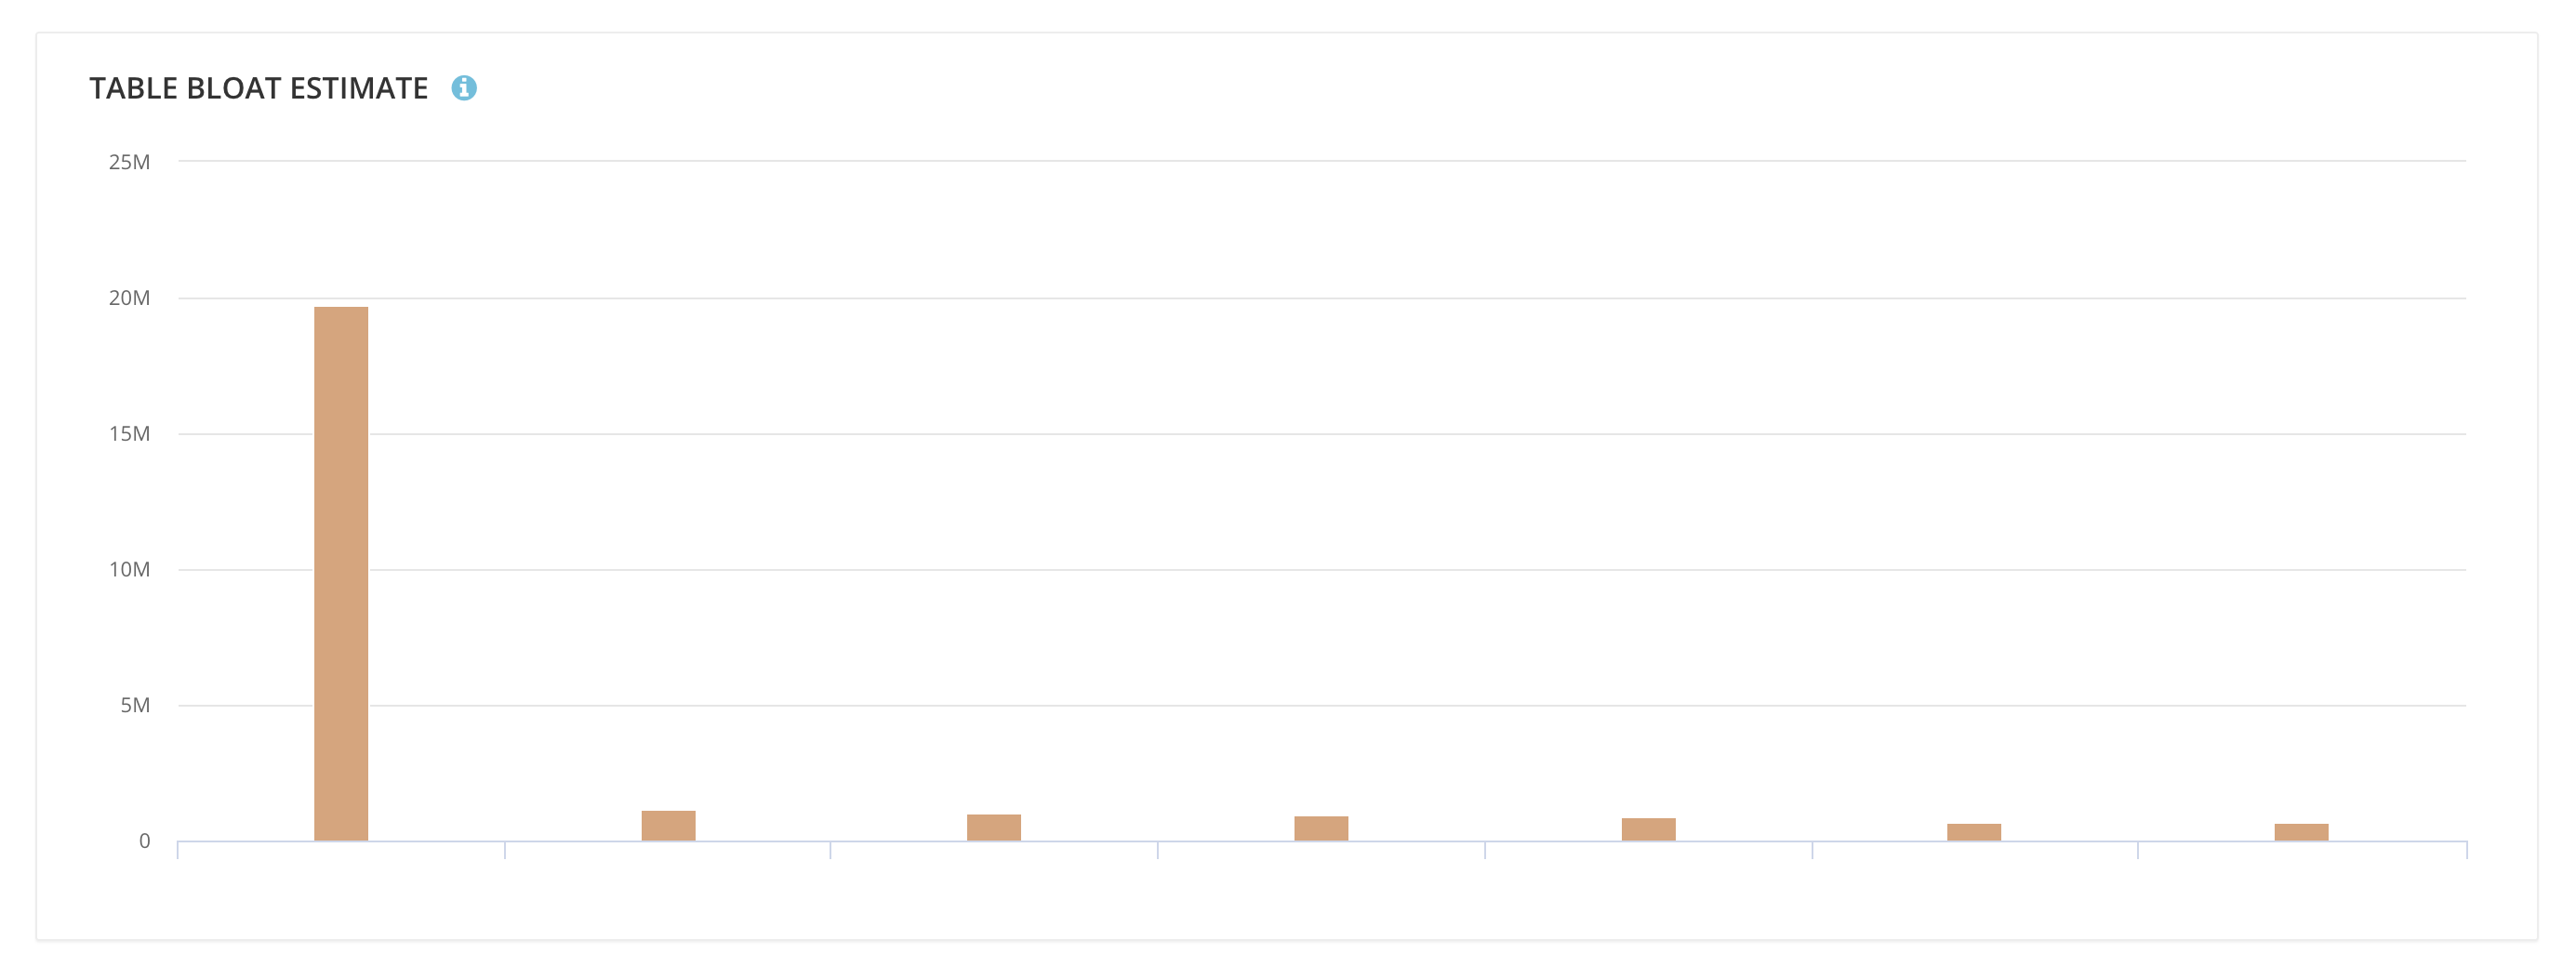
Table Bloat Estimate
An estimate of table bloat computed from usage and size statistics. This is an estimate only - please contact [email protected] to calculate your actual bloat metrics.
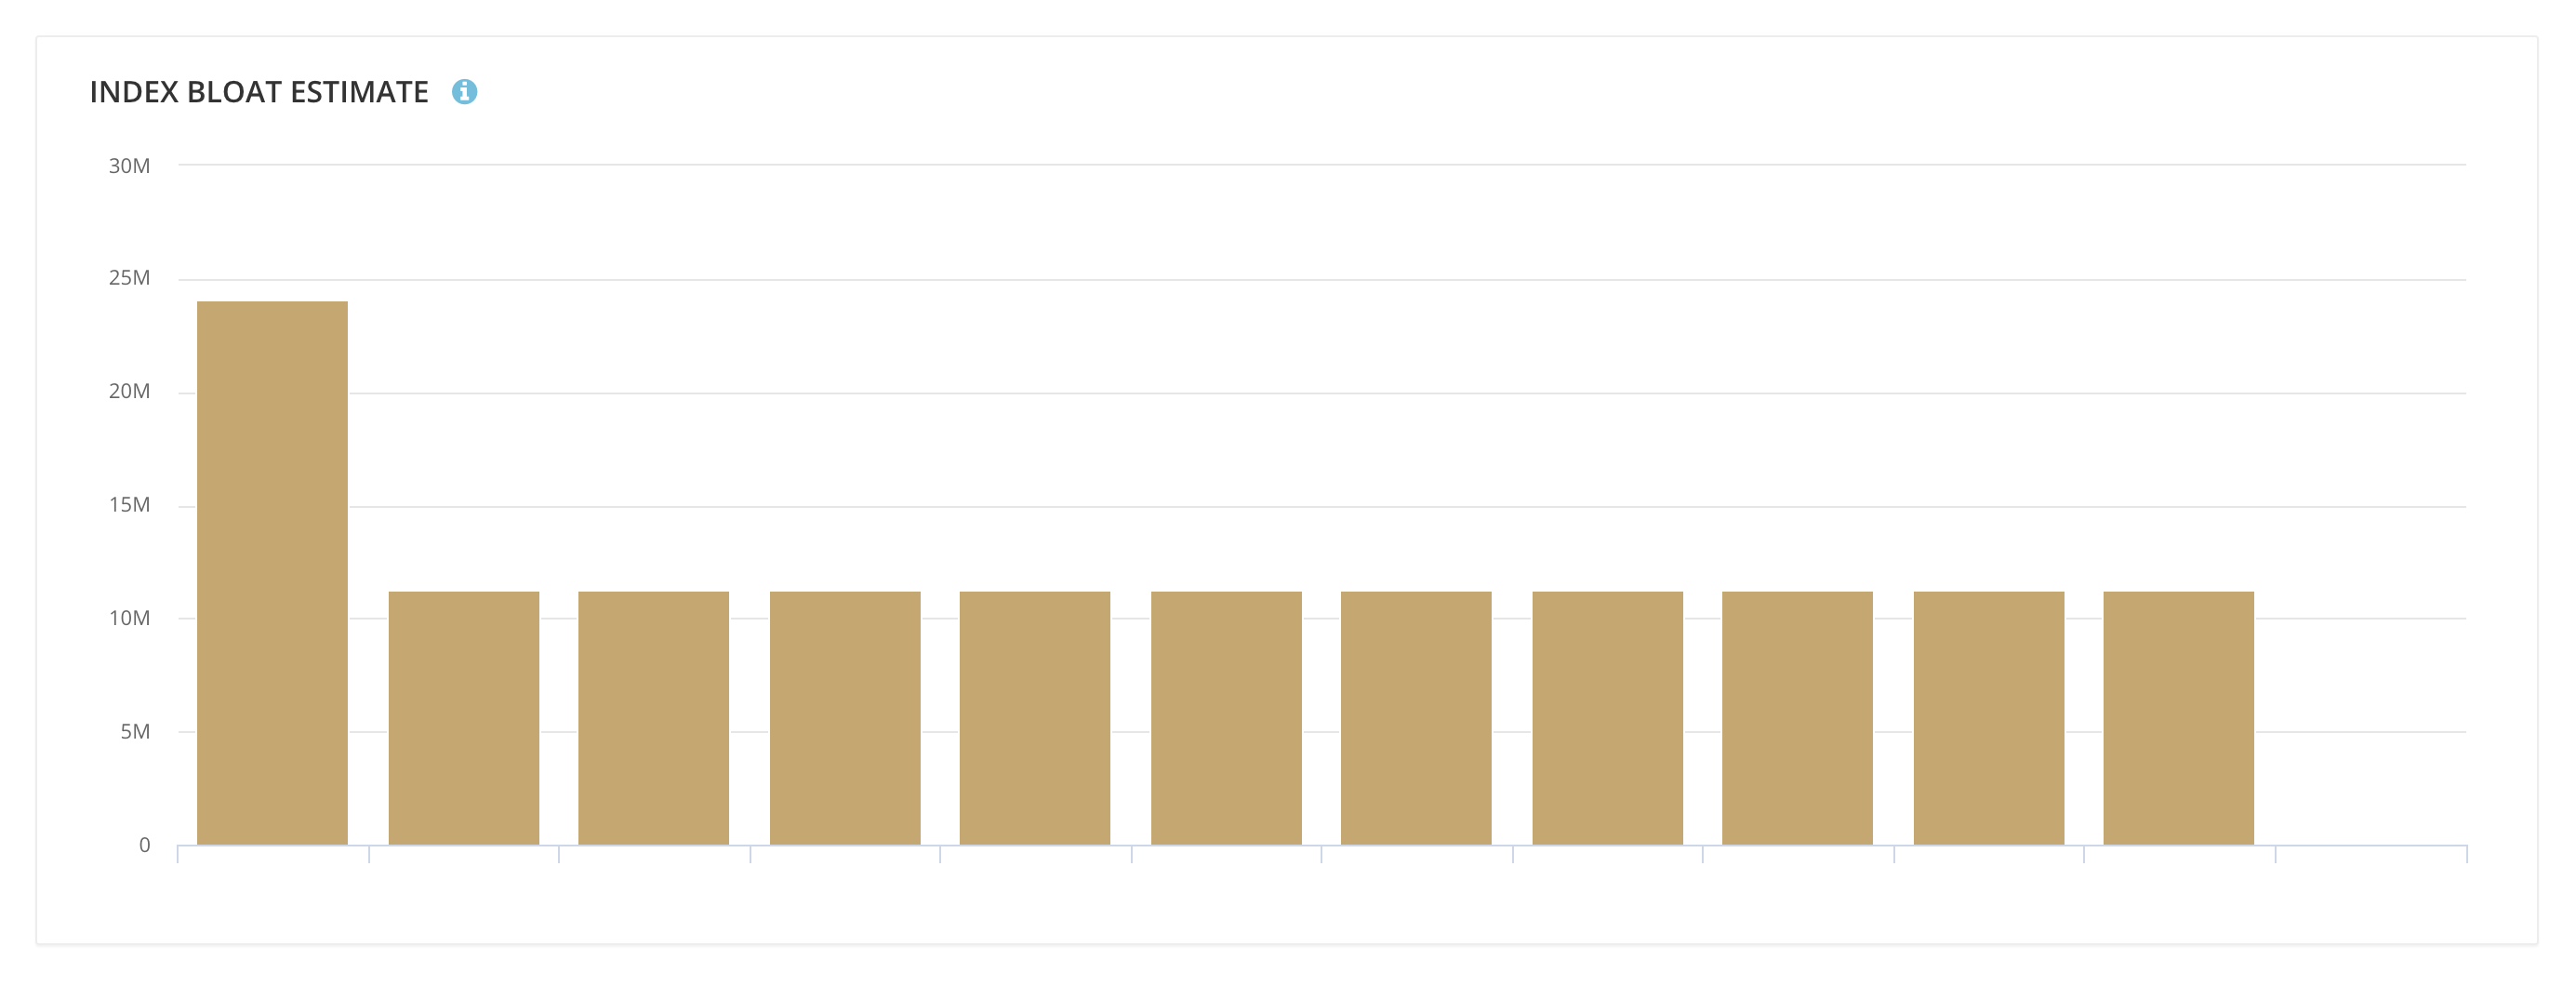
Index Bloat Estimate
An estimate of the bloat on your BTree Indexes computed from usage and size statistics. This is an estimate only - please contact [email protected] to calculate your actual bloat metrics.
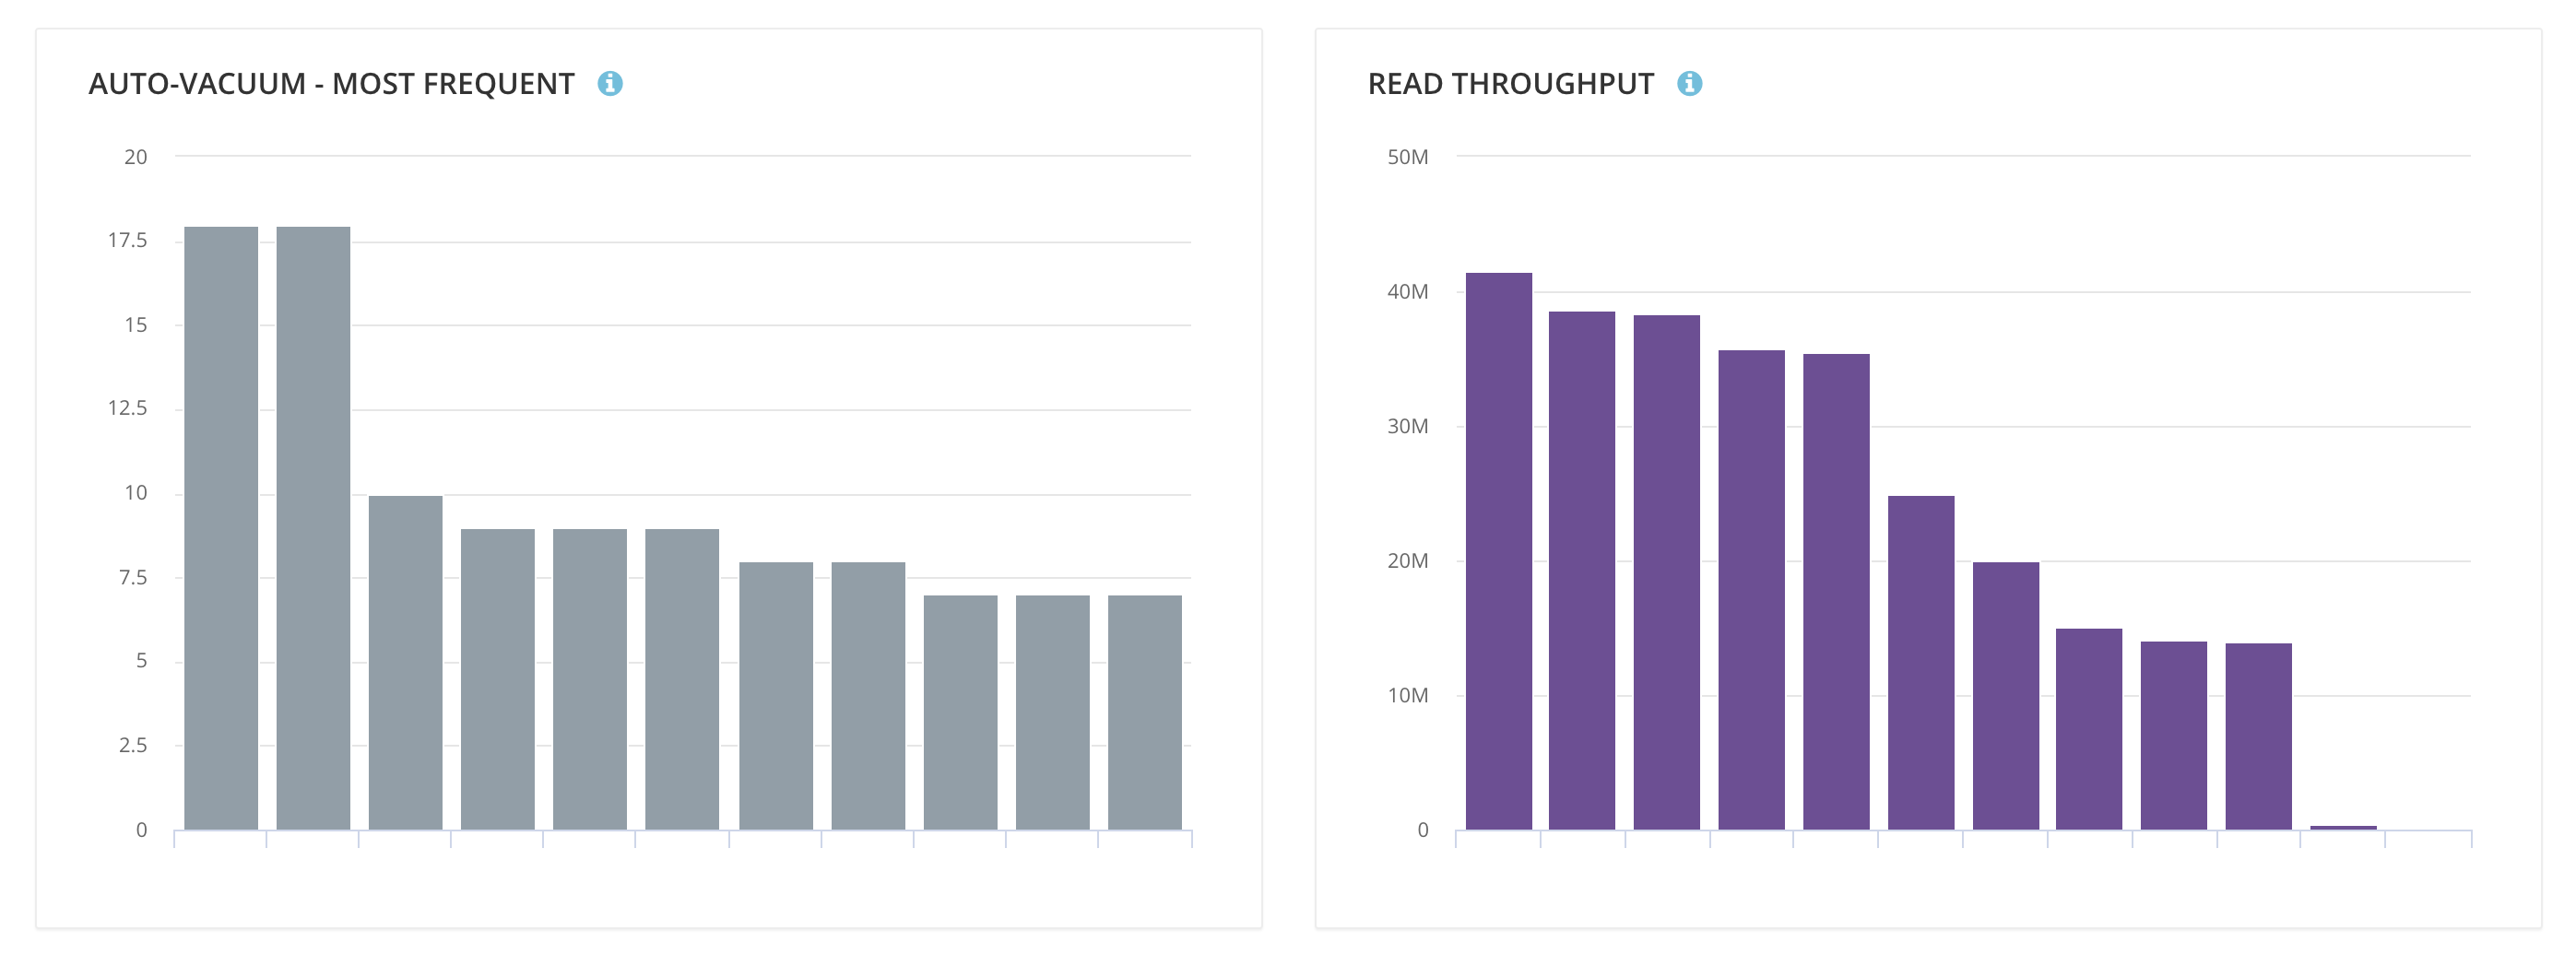
Auto-Vacuum - Most Frequent
Most frequently vacuumed tables in this deployment. These are the tables where auto-vacuum has been called most often. This typically means there is a lot of updates/deletes going on in this table.
Read Throughput
Largest tables in this deployment, by number of rows fetched from database.
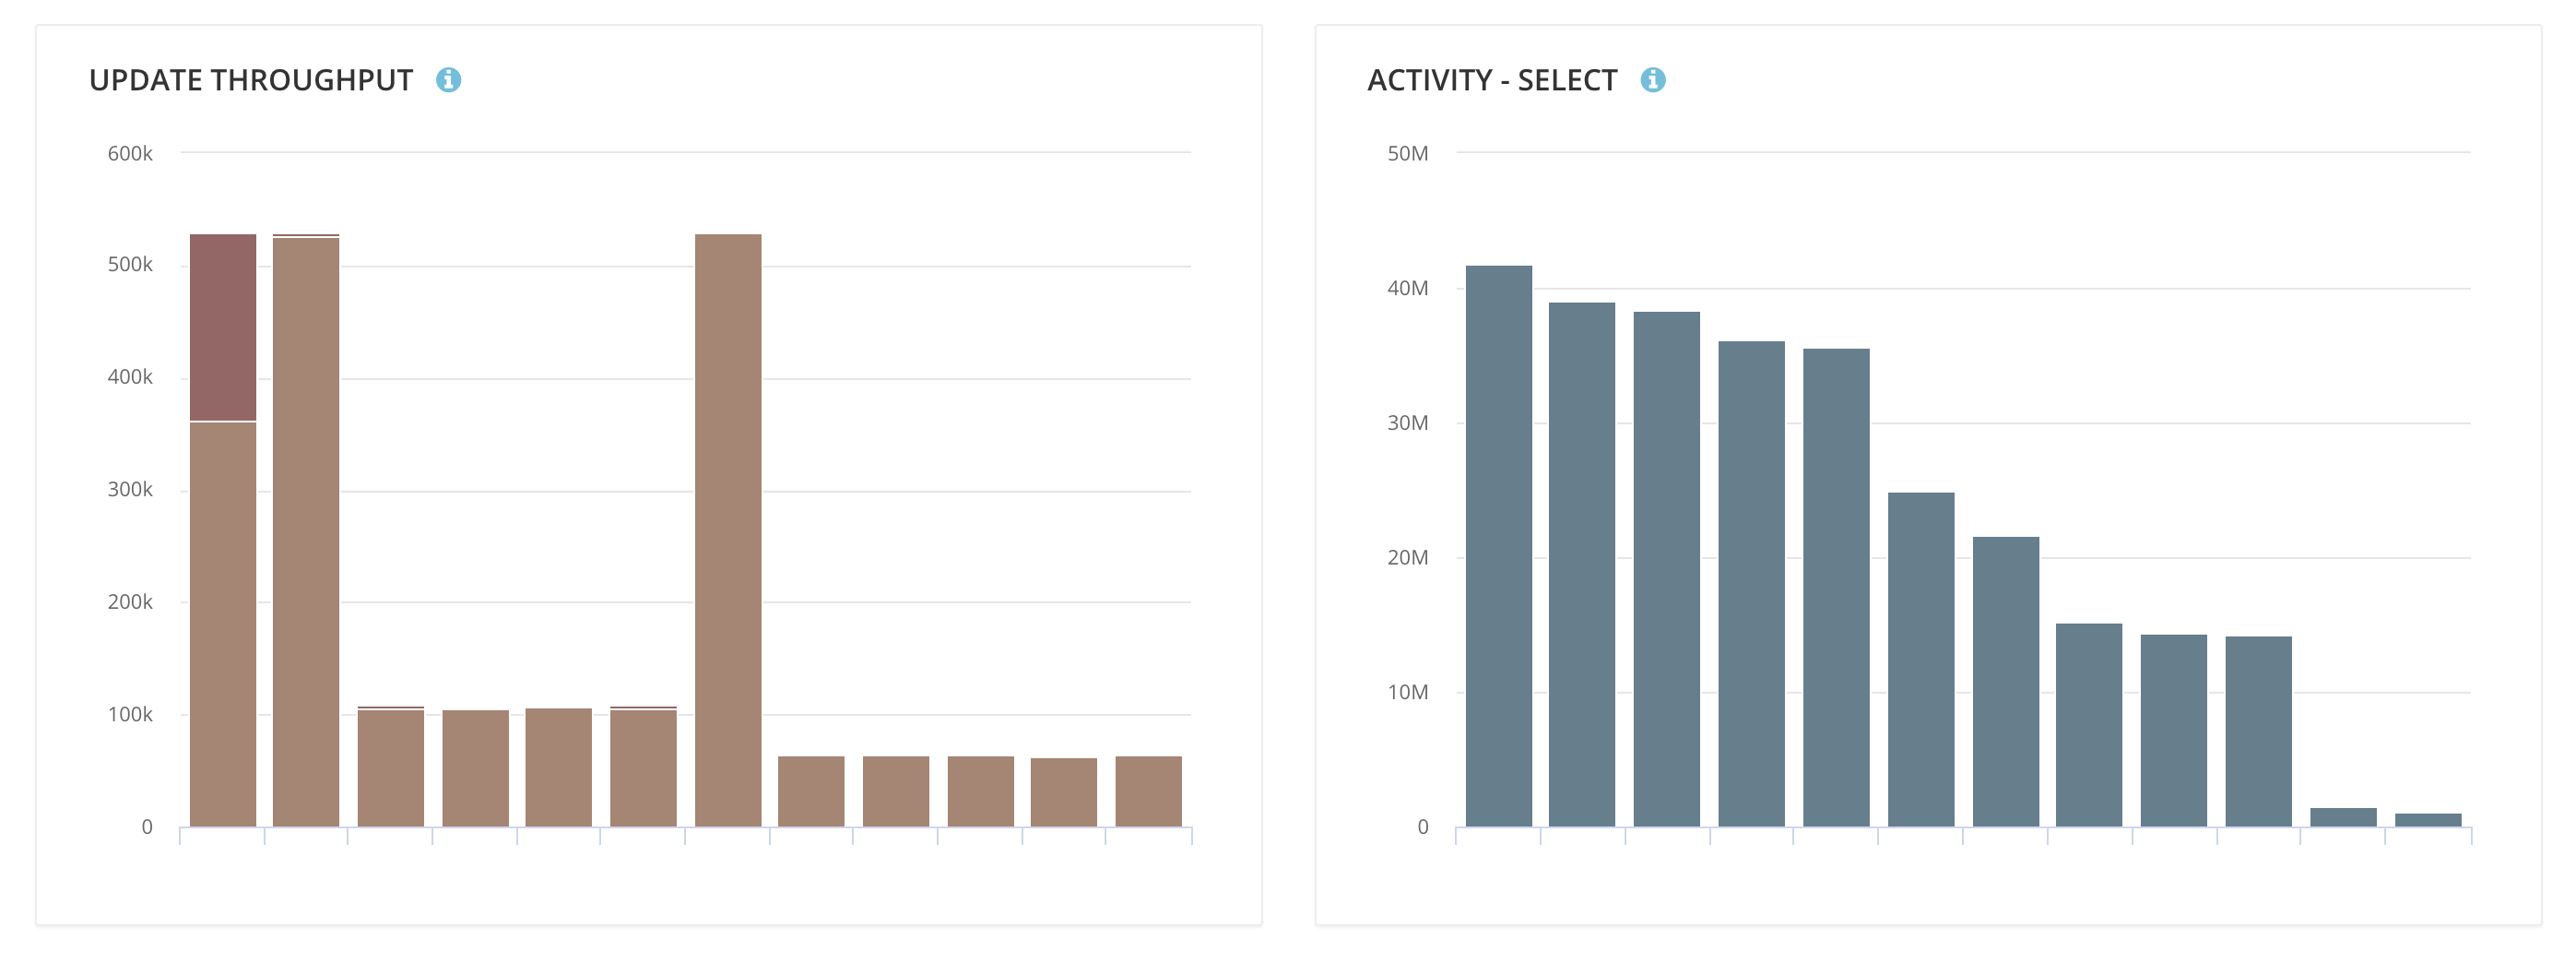
Update Throughput
Tables with the most rows updated. This graph shows how many rows were updated in the normal manner (number of updates) vs. how many updated rows took advantage of Heap-Only-Update (number of HOT updates). HOT updates are designed to be faster, but work only if no indexed column is being updated. If your total updates are very high for a table, and very few of them are HOT updates, your update performance will degrade.
Activity - Select
Top tables by select activity.
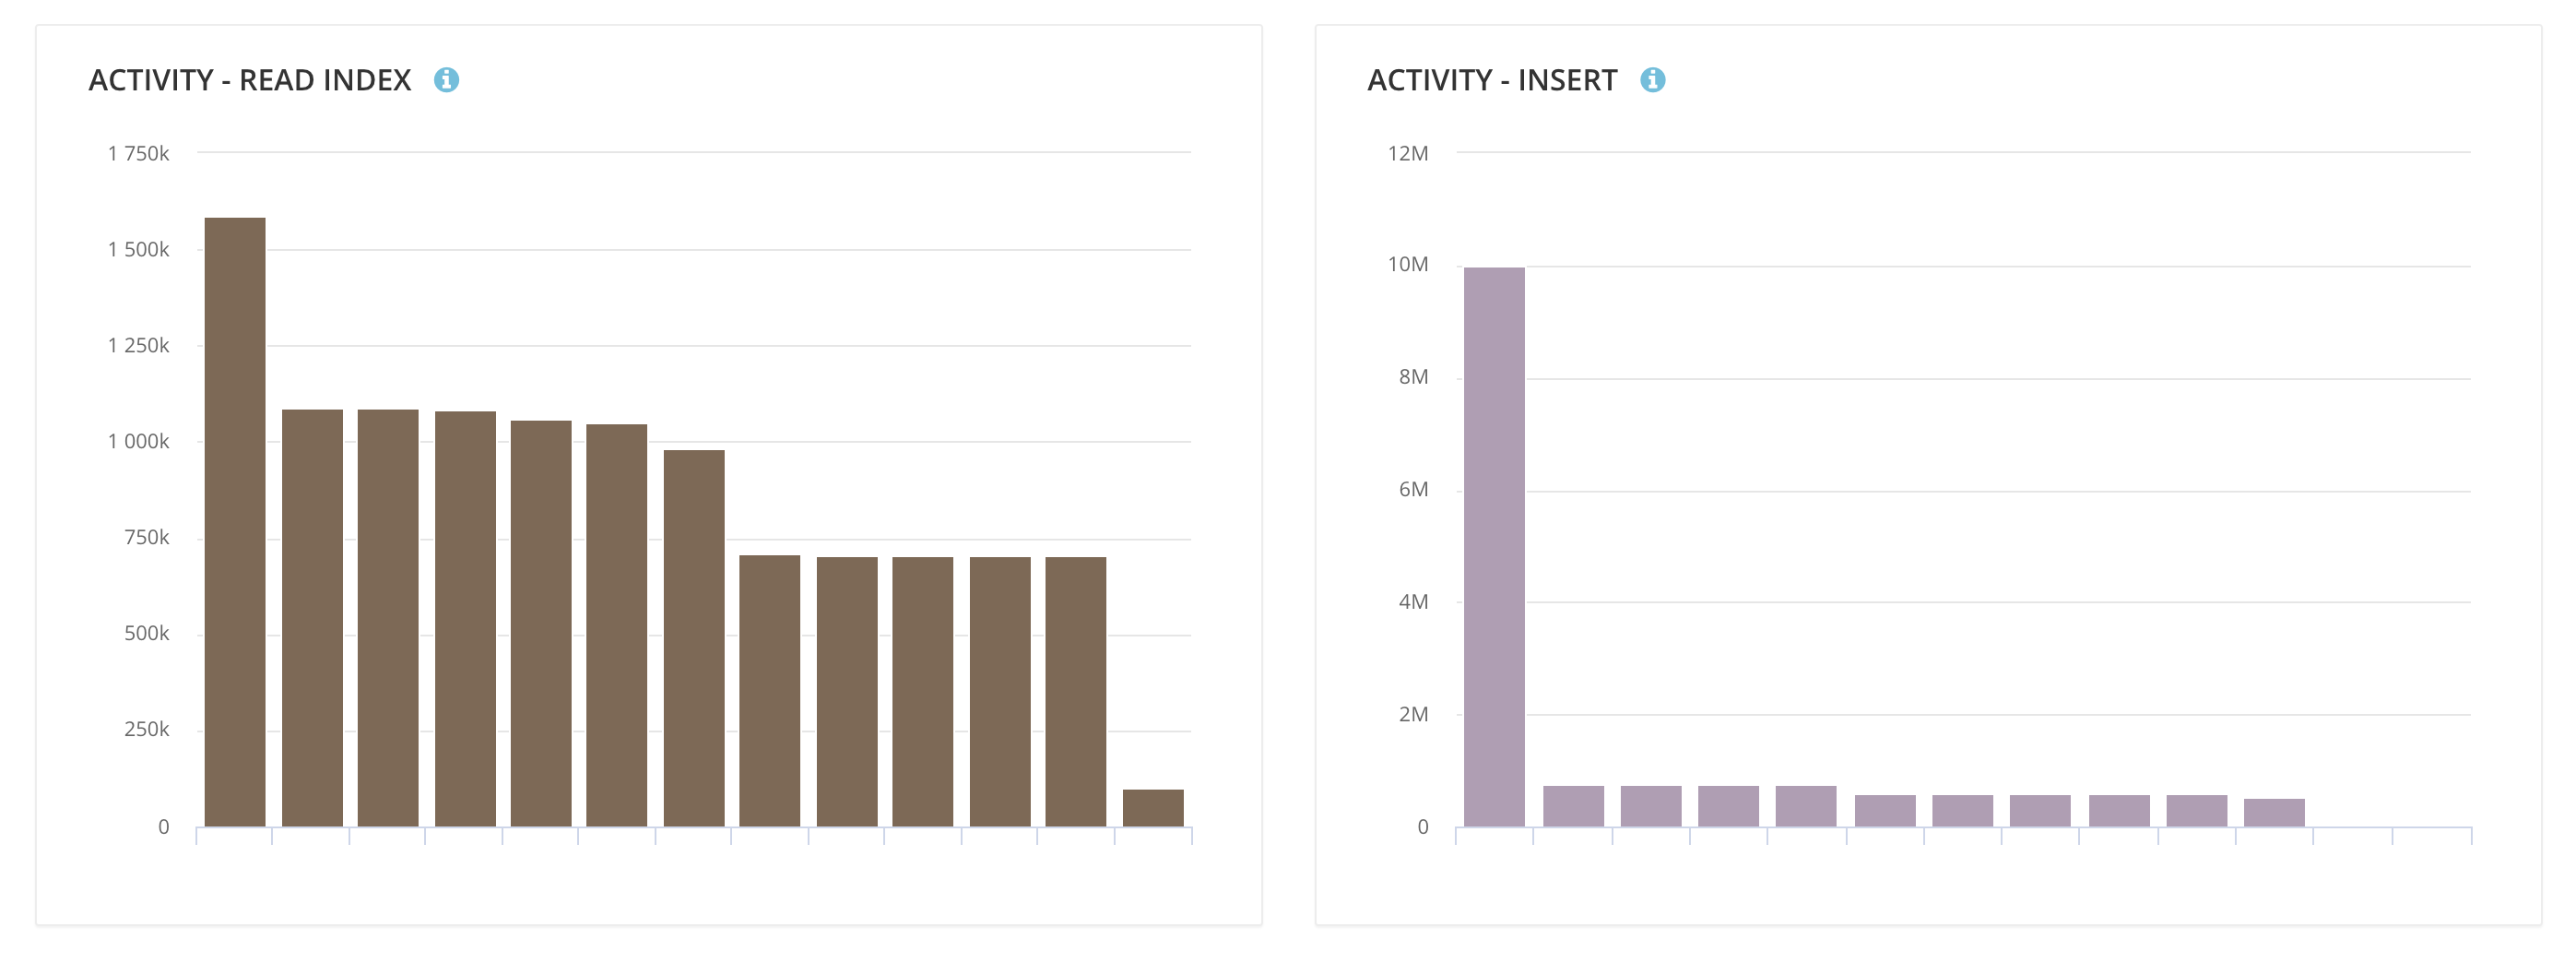
Activity - Read Index
Top indexes by scan activity.
Activity - Insert
Top tables by insert activity.
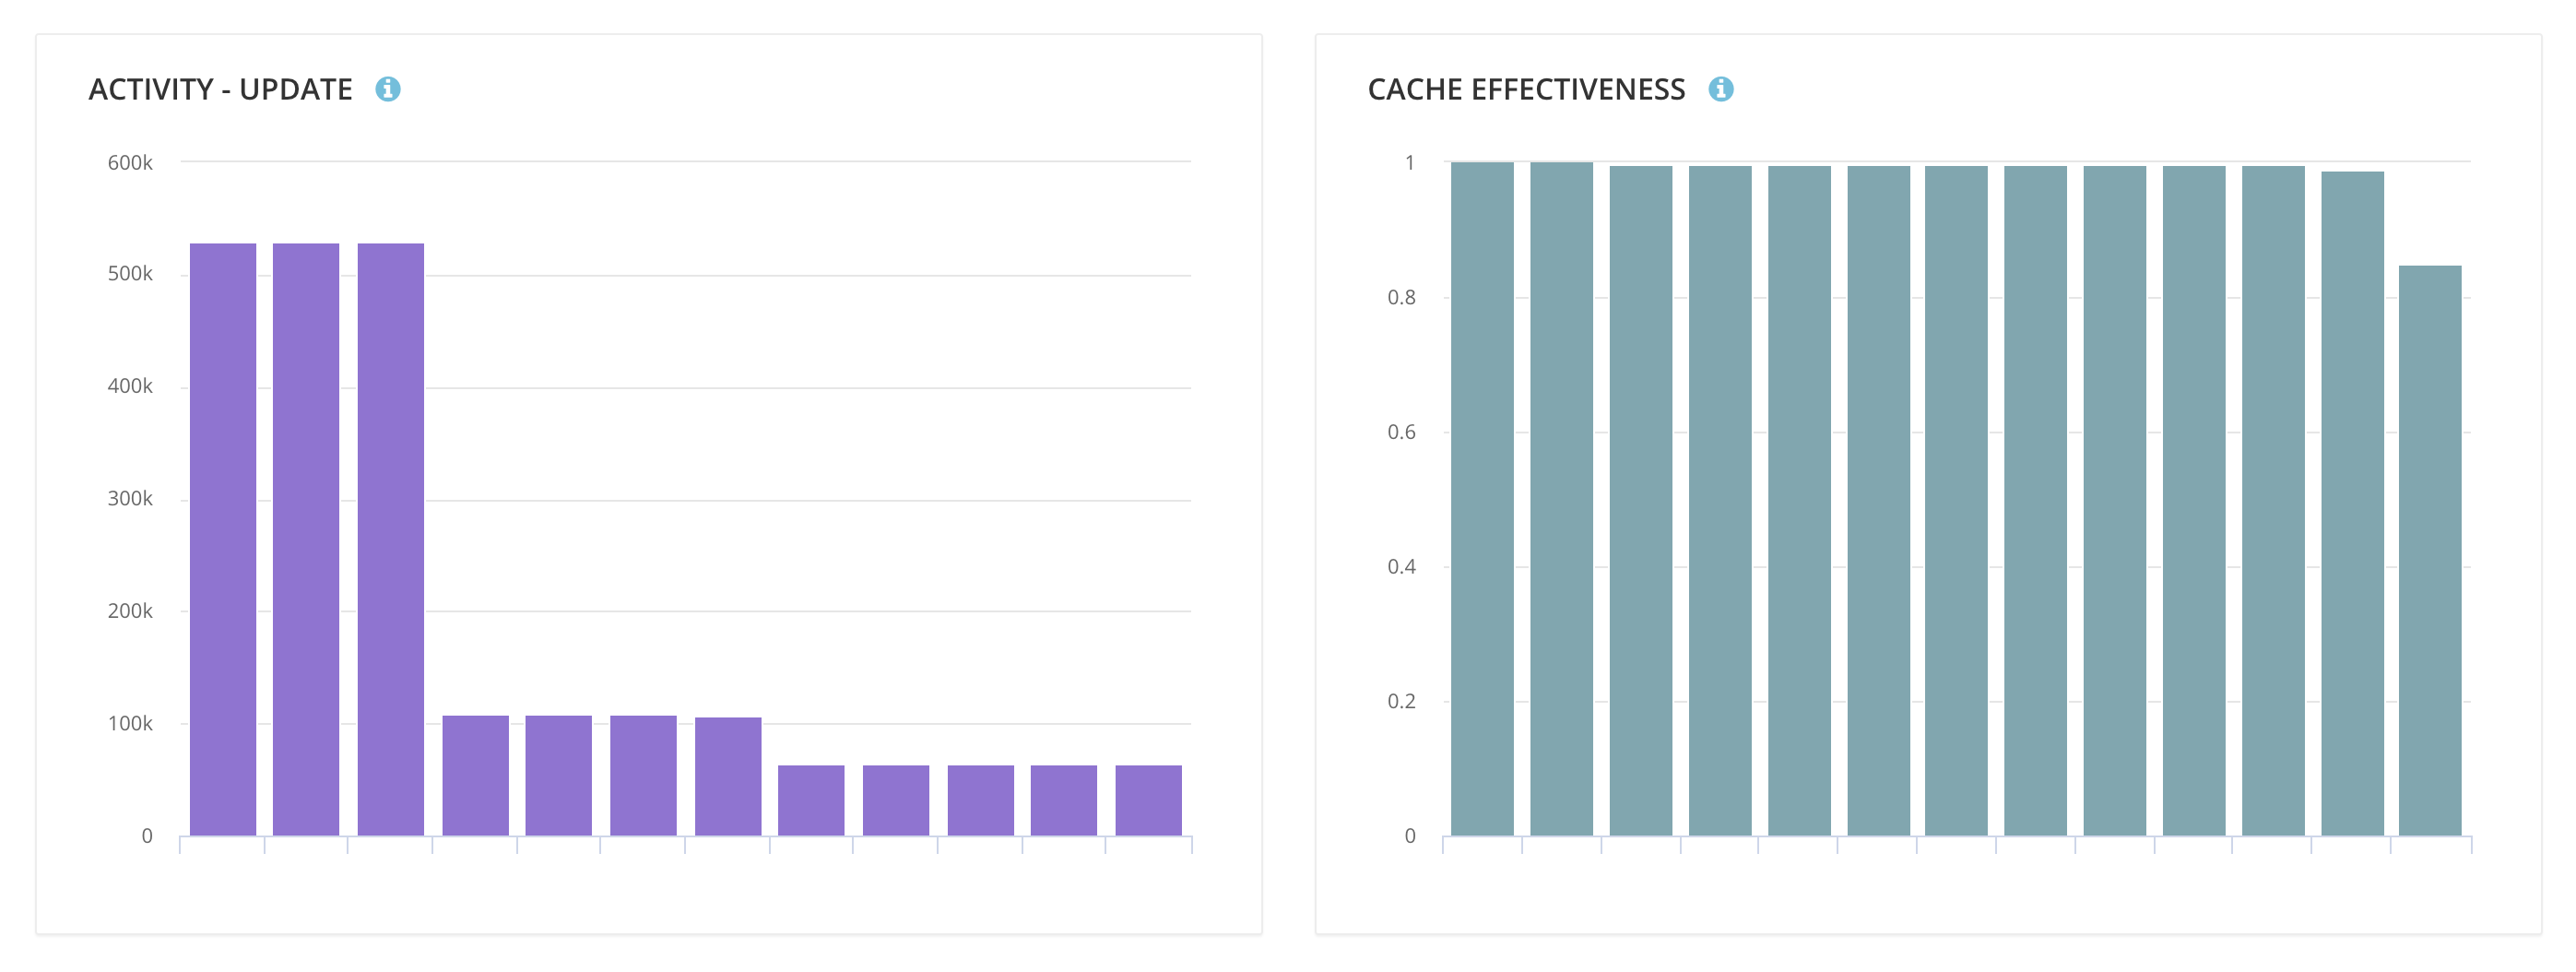
Activity - Update
Top tables by update activity.
Cache Effectiveness
Top tables by cache effectiveness. This graph shows the ratio of (Blocks read from Buffer Cache) to (Total Blocks Read). If this ratio is very low, your database performance might degrade. Using a machine with more RAM would help improve performance.
Sequential Scans
Top tables, by number of sequential scans initiated. If the number of sequential scans is much higher than number of index scans, it might indicate inefficient indexing on the table.
If you have any questions, please email us at [email protected].
Updated 11 months ago
