PostgreSQL Monitoring Console
Analyze your PostgreSQL hosting metrics with ScaleGrid DBaaS, including queries, connections, network, threads, cache, tables, objects, and handler activity on your clusters Monitoring Console.
ScaleGrid PostgreSQL hosting and database management solutions come with advanced monitoring metrics to help ensure the continuous health of your deployments. Each cluster comes with its own unique PostgreSQL Monitoring Console found on your cluster details page.
Click on your Monitoring icon to get started:
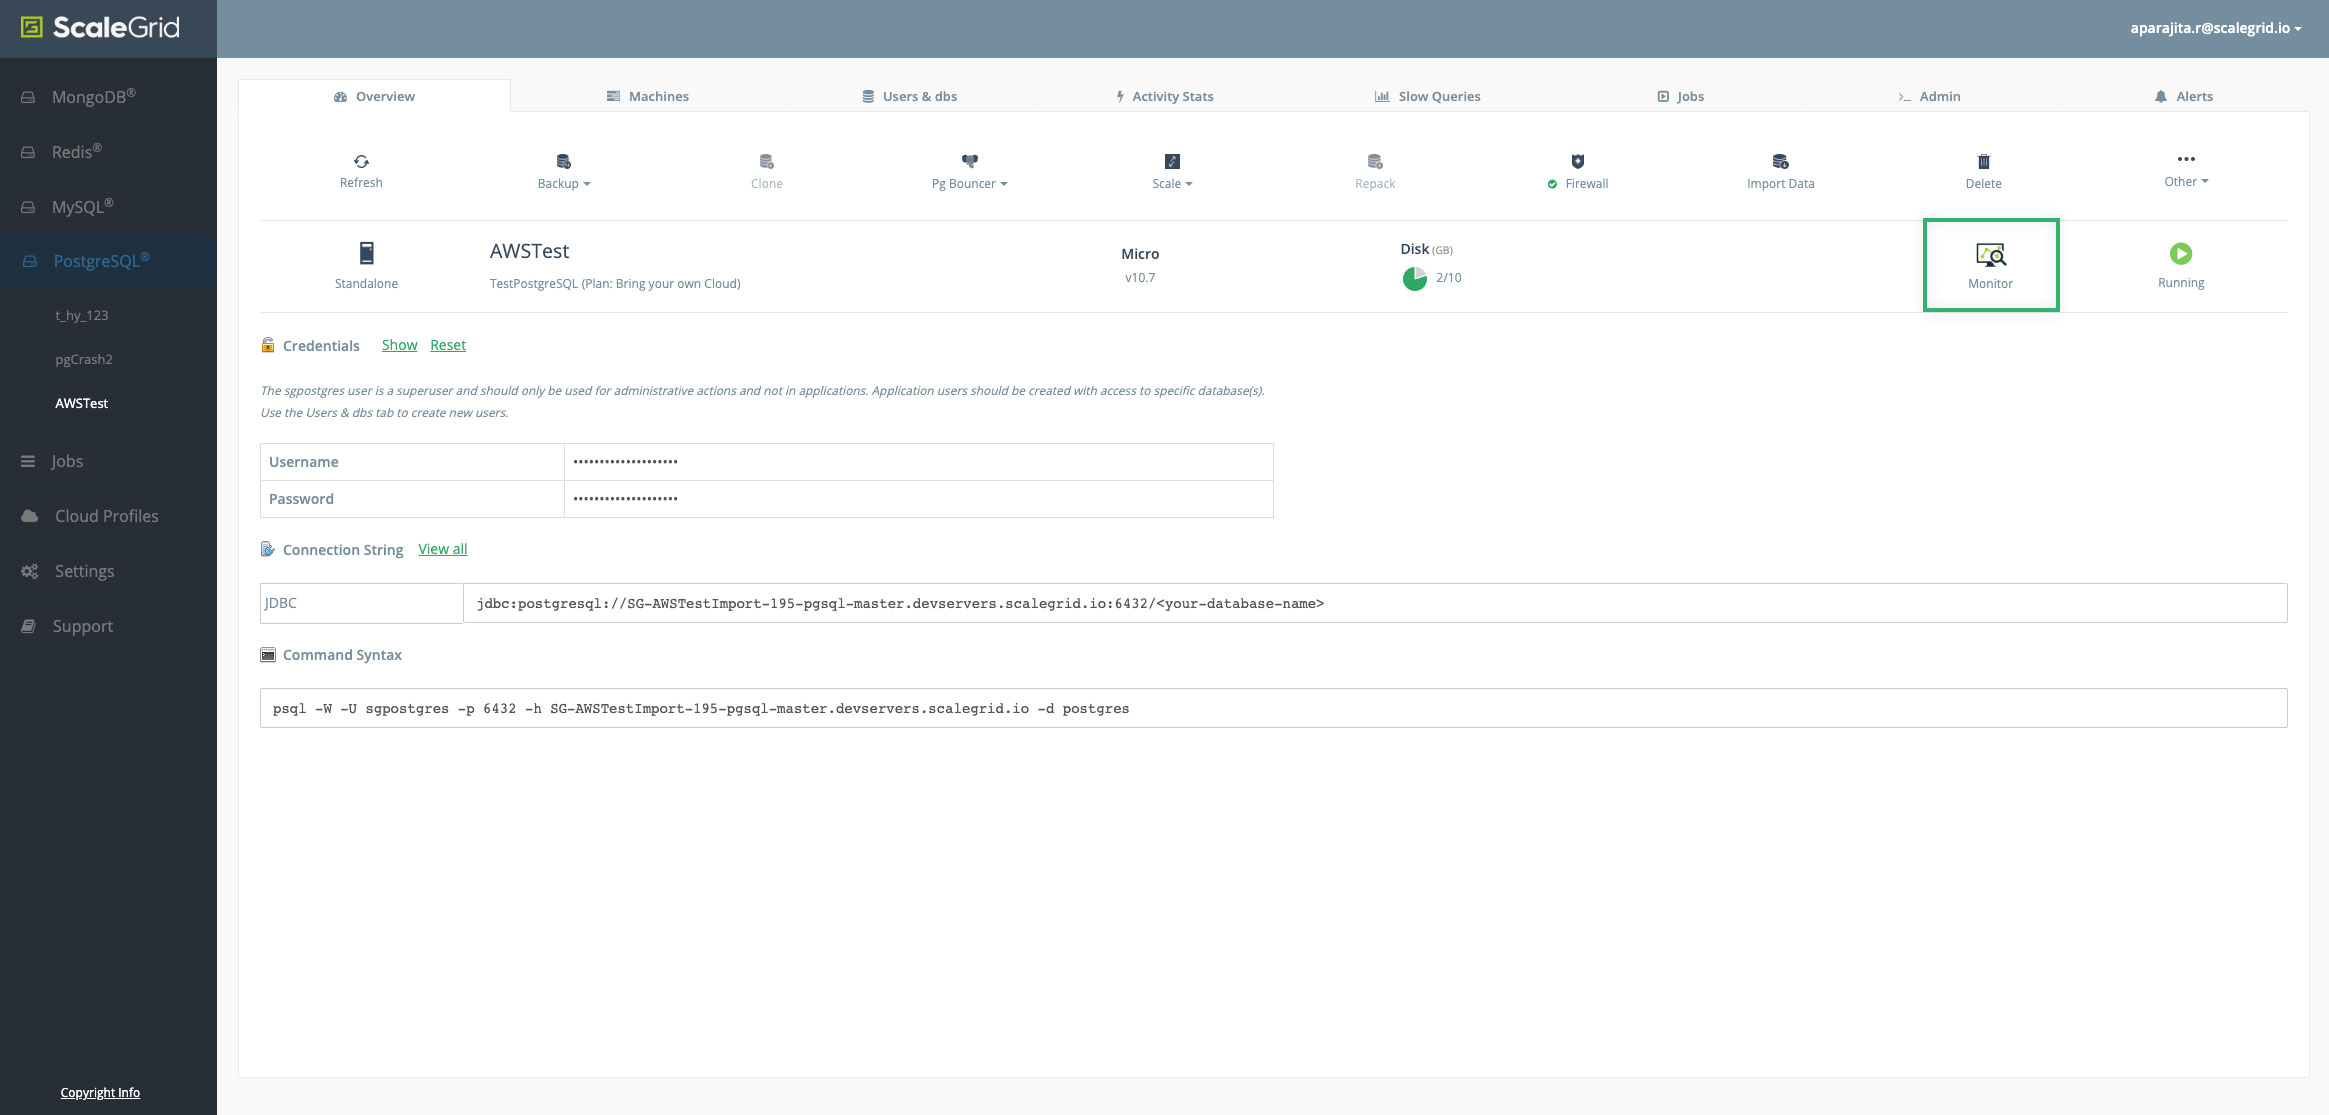
PostgreSQL Hosting Monitoring & Metrics
In this help doc, we're going to walk you through all of the PostgreSQL metrics in your Monitoring Console.
At the top of your PostgreSQL Monitoring Console, you can use the dropdown menus to change the view for your PostgreSQL master vs. standby(s), time period, and time zone.
You can also click the green Compare Servers link to analyze how your master and standby(s) perform side-by-side for any given time range.
Chart AnnotationsSERVER ROLE CHANGE
Indicates that the role (Master/Standby) of the Server instance changedSERVER RESTART
Indicates that the Server process restarted
PostgreSQL Cluster Activity
The PostgreSQL Cluster Activity chart is the first graph on your Monitoring Console, and displayed per second:
- ROWS SELECTED: Number of PostgreSQL rows selected/sec
- ROWS UPDATED: Number of PostgreSQL rows updated/sec
- ROWS INSERTED: Number of PostgreSQL rows inserted/sec
- ROWS DELETED: Number of PostgreSQL rows deleted/sec
- COMMIT OPS: Number of PostgreSQL commit ops/sec
- ROLLBACK OPS: Number of PostgreSQL rollback ops/sec

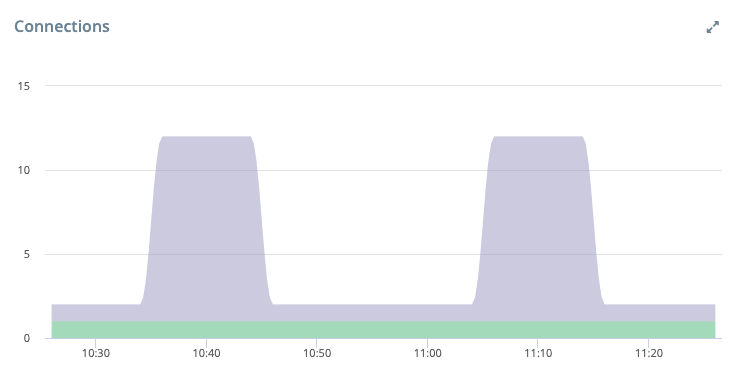
PostgreSQL Current Connections
The number of connections currently open to PostgreSQL:
- Active Connections: Number of currently active connections to the server (green)
- Idle Connections: Number of idle connections to the server (purple)
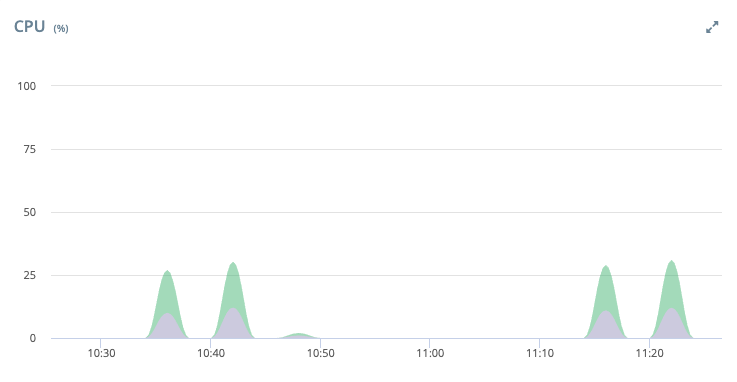
PostgreSQL CPU %
Analyze your current PostgreSQL CPU usage:
- USER (%): The percentage of time the CPU spent in user applications (purple)
- SYSTEM (%): The percentage of time the CPU spent in the operating system (green)
- NICE (%): The percentage of time the CPU spent in nice mode (red)
- IOWAIT (%): The percentage of time the CPU spent waiting for IO operations to complete (orange)
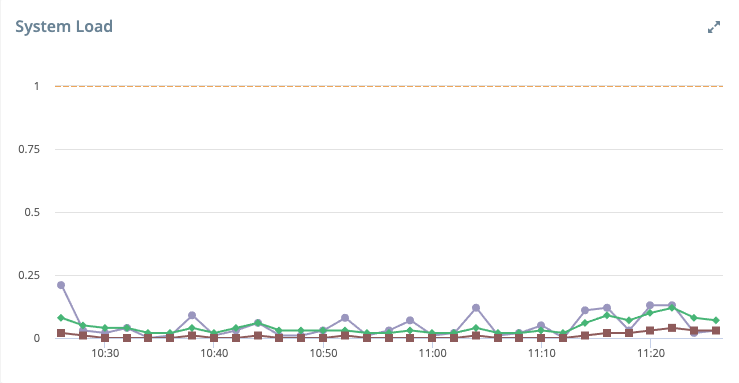
PostgreSQL System Load
Load average is a measurement of how many tasks are waiting in a kernel run queue (not just CPU time but also disk activity) over a period of time. If System Load exceeds the number of cores, the CPU is considered over-utilized.
- LOAD_AVG_1M: Average system load for the last 1 minute (purple)
- LOAD_AVG_5M: Average system load for the last 5 minutes (green)
- LOAD_AVG_15M: Average system load for the last 15 minutes (red)
- CPU Cores: Number of CPU cores (orange)
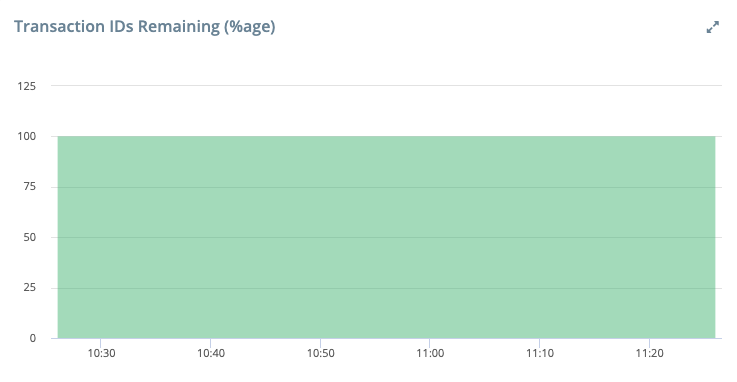
PostgreSQL Transaction IDs Remaining (Percentage)
Percentage of transaction IDs remaining before wraparound. If this number reaches 0, your database will stop accepting any new transactions. If this goes below 0.05%, you should trigger a manual vacuum.
- TXID_REMAINING: Percentage of transaction IDs (txid) remaining till wraparound (green)
PostgreSQL System Memory
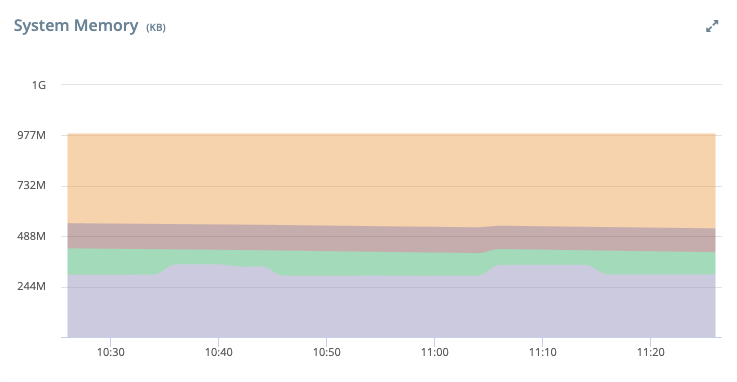
System Memory (RAM) usage:
- USED (KB): Used memory (purple)
- FREE (KB): Free memory (green)
- BUFFERS (KB): Memory used for buffers (red)
- CACHED (KB): Memory used for page cache (orange)
PostgreSQL Disk Usage
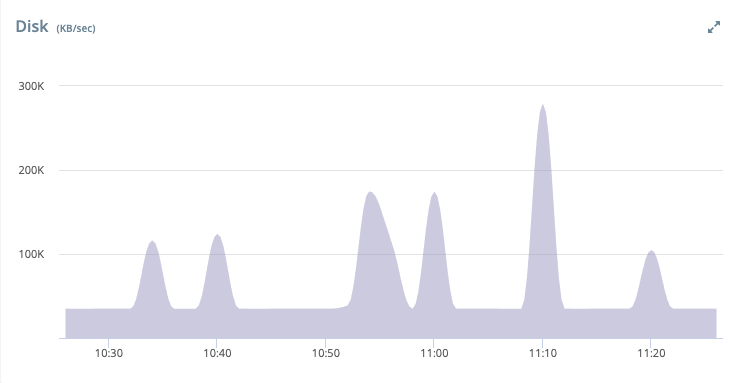
- READ (KB/sec): Total disk reads/sec (green)
- WRITE (KB/sec): Total disk writes/sec (purple)
PostgreSQL Locks
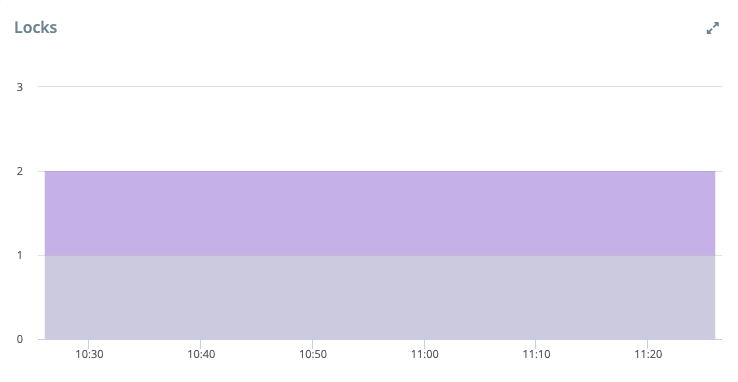
Number of locks held on the PostgreSQL Cluster
- Access_Share Locks: Total number of locks held in acess_share mode. The SELECT command acquires a lock of this mode on referenced tables. In general, any query that only reads a table and does not modify it will acquire this lock mode. (purple)
- Row_Share Locks: Total number of locks held in row_share mode. The SELECT FOR UPDATE and SELECT FOR SHARE commands acquire a lock of this mode on the target table(s). (blue)
- Row_Exclusive Locks: Total number of locks held in row_exclusive mode.The commands UPDATE, DELETE, and INSERT acquire this lock mode on the target table. In general, this lock mode will be acquired by any command that modifies data in a table. (grey)
- Share_Update_Exclusive Locks: Total number of held in share_update_exclusive mode. This mode protects a table against concurrent schema changes and VACUUM runs. (orange)
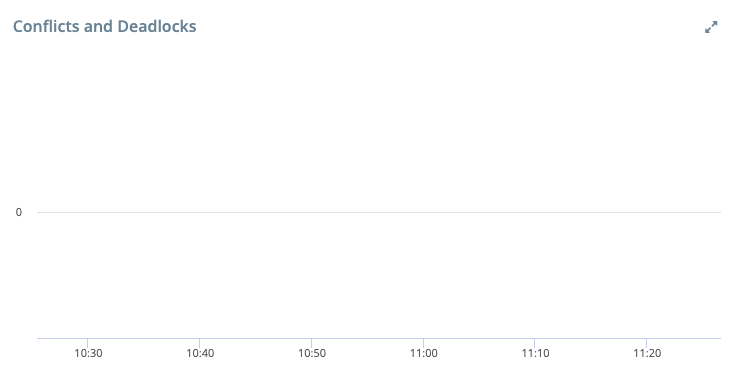
PostgreSQL Conflicts and Deadlocks
Number of operations cancelled due to lock conflicts or deadlocks. If you have deadlocked operations, you may have to manually kill one of them.
- Deadlock: Number of deadlocks currently in the server (green)
- Conflicts: Number of operations that were aborted due to lock conflicts (purple)
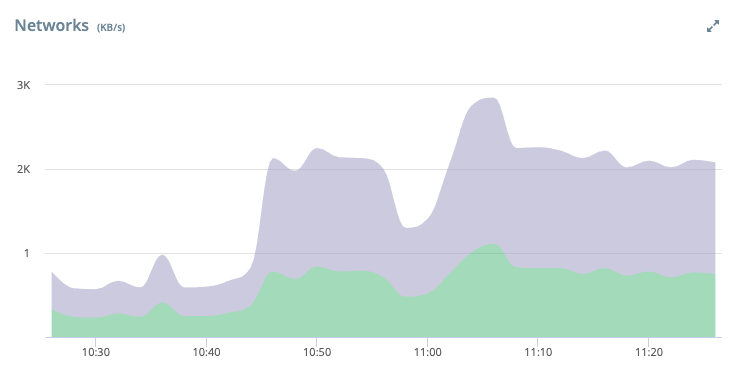
PostgreSQL Network Usage
Network usage for the machine:
- Inbound Network (KB/s): Averages KBytes/sec sent into database server (green)
- Outbound Network (KB/s): Averages KBytes/sec sent out of the database server (purple)
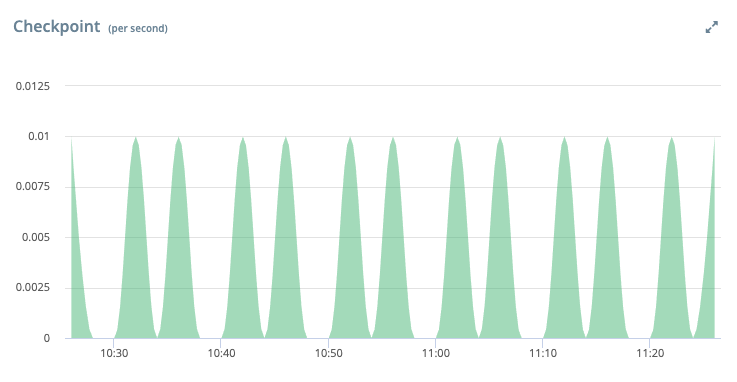
PostgreSQL Checkpoints
Scheduled and requested checkpoints hit by the system:
- Scheduled Checkpoints: Number of scheduled checkpoints/second that were performed in the interval (green)
- Requested Checkpoints: Number of requested checkpoints/second that were performed in the interval (purple)
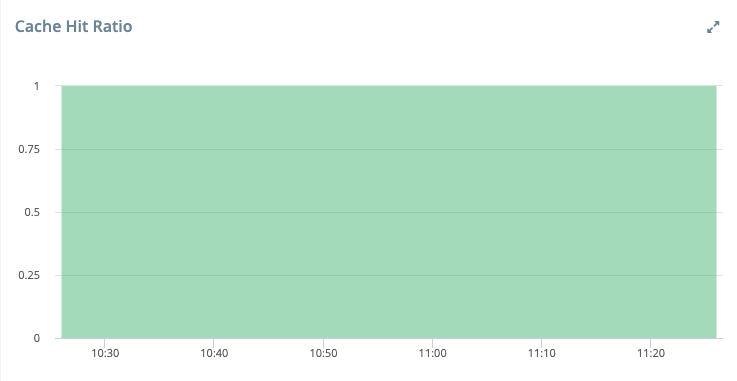
PostgreSQL Cache Hit Ratio
PostgreSQL Buffer Cache Hit Ratio for queries:
- CACHE_HIT_RATIO: Ratio of reads-from-buffer-cache to total-reads. This does not take in to account hits on the file system's cache (green)
PostgreSQL Temporary Data
Bytes of data written temporarily to disk to support transactions:
- Temporary Data (bytes): The amount of data written temporarily to disk to execute queries: PostgreSQL reserves a certain amount of memory—specified by work_mem (4 MB by default)—to perform sort operations and hash tables needed to execute queries. When a complex query requires access to more memory than work_mem allows, it has to write some data temporarily to disk in order to do its work. This impacts performance, and might indicate a need to increse the work_mem. However, it’s important not to set this too high, because it can encourage the query planner to choose more inefficient queries. (green)
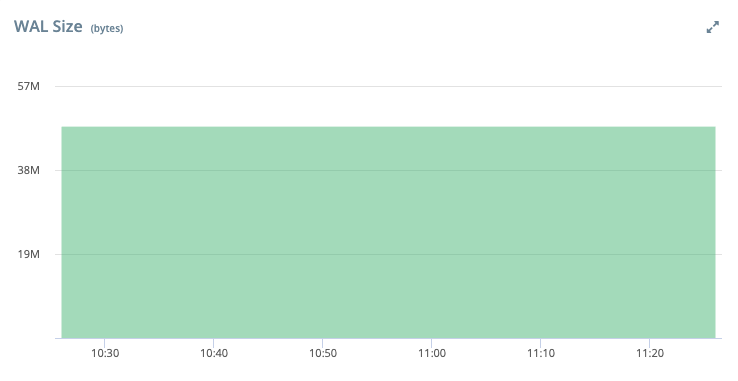
PostgreSQL WAL Size
Size of the current transaction log on the machine:
- WAL Size (bytes): The size of the transaction log (green)
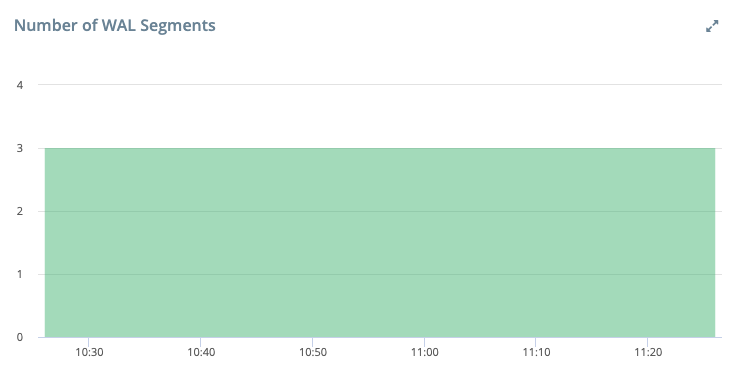
Number of WAL Segments
The number of Write Ahead Log (WAL) segments currently on disk:
- WAL_FILE_COUNT: Number of WAL Segments currently on disk (green)
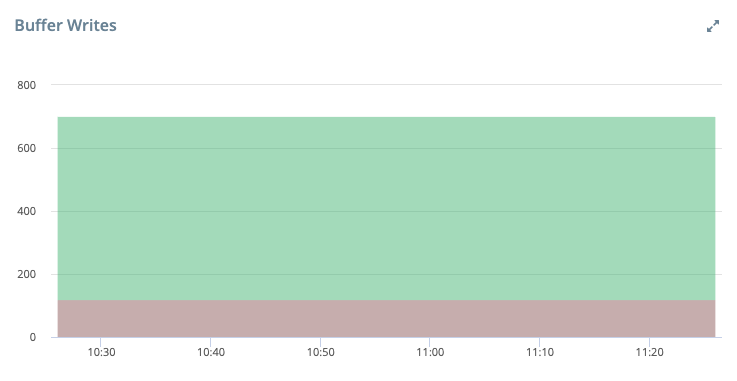
PostgreSQL Buffer Writes
The number of buffers written to disk by background writer:
- DISK_WRITE_BACKEND: The number of dirty buffers written to storage directly by a backend (client connection), to make space for new allocations. A high value here can either indicate insufficient shared buffer space (so the backends have to juggle data between RAM and storage) or the need to increase bgwriter_lru_multiplier and decrease bgwriter_delay (so that bgwriter can take the load off the backends) (red)
- DISK_WRITE_BGWRITER: The number of buffers written to disk by the background writer. The role of the bgwriter is to reduce the disk writes performed during a checkpoint or as part of transaction (by the backend). The bgwriter process flushes dirty pages little by little with minimal impact on database activity. This ensures better system performance. You want this value to be the highest amongst the buffer writes. (orange)
- Disk Write Checkpoint: The number of buffers written to disk during checkpoints. A high value here indicates bgwriter might need an increase in bgwriter_lru_multiplier and decrease in bgwriter_delay - that will allow more buffers to be flushed in the background, making checkpoints cheaper. (green)
PostgreSQL WAL Write Rate
The rate at which Write Ahead Log (WAL) is being written to disk:
- WAL_GENERATION_RATE (bytes/sec): Number of bytes being written to disk per second for the Write Ahead Log (green)

Updated 12 months ago
