Scalegrid Monitoring Console for MongoDB®
Find Your Monitoring Console
Each ScaleGrid cluster has its own Monitoring Console to analyze the performance, usage, and availability of your MongoDB® cloud deployments. You can find it by going into any of your MongoDB® clusters and then clicking on the Monitoring icon in your Overview tab.
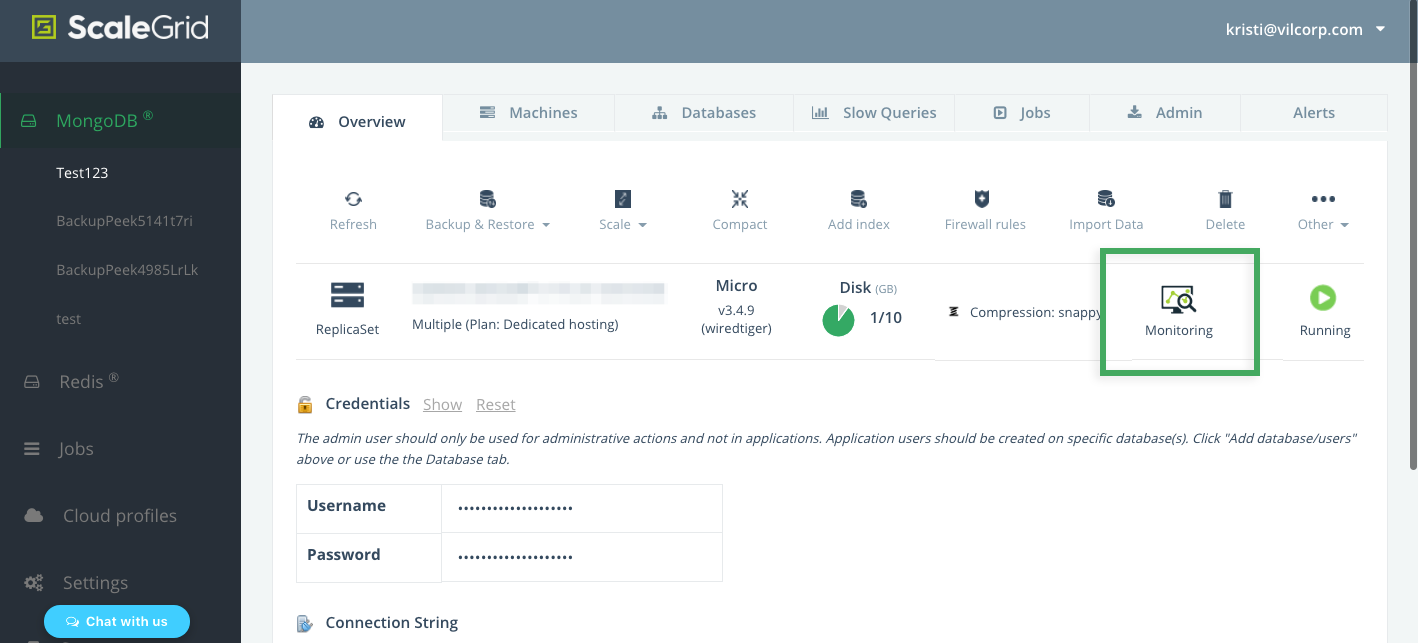
Here are the metrics you'll be able to analyze through your ScaleGrid Monitoring Console :
Chart Annotations:Annotations may appear as colored vertical lines on your charts to indicate server events. The color/events combinations are:
Server Role Change: Indicates that the role (Primary/Secondary/Master/Slave) of the server instance changed.
Server Restart: Indicates that the server process restarted.
CPU
CPU (Central Processing Unit) is the electronic circuitry within your MongoDB® server that carries out the instructions of a computer program by performing the basic arithmetic, logical, control and input/output (I/O) operations specified by the instructions.
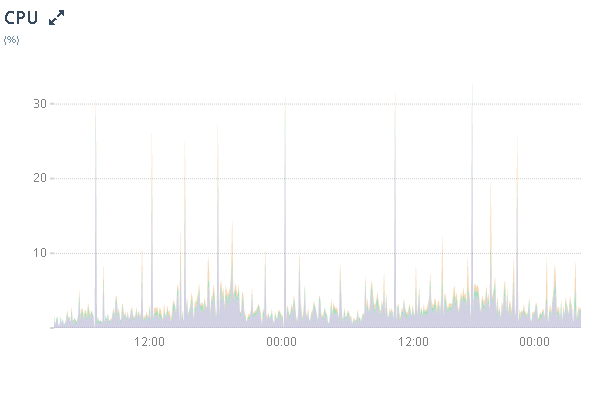
MongoDB® Monitorng Console - CPU
You can monitor your CPU usage on the ScaleGrid Monitoring Console to see whether you've experienced any spikes, analyze idle percentages, and find indications for potential slow queries affecting your CPU load time.
- User (%): The percentage of time the CPU spent in user applications.
- System (%): The percentage of time the CPU spent in the operating system.
- Nice (%): The percentage of time the CPU spent in nice mode.
- IOWAIT (%): The percentage of time the CPU spent waiting for IO operations to complete.
System Memory
By default, your MongoDB® clusters will use WiredTiger as their storage engine, and you System Memory is the overview of your RAM usage.
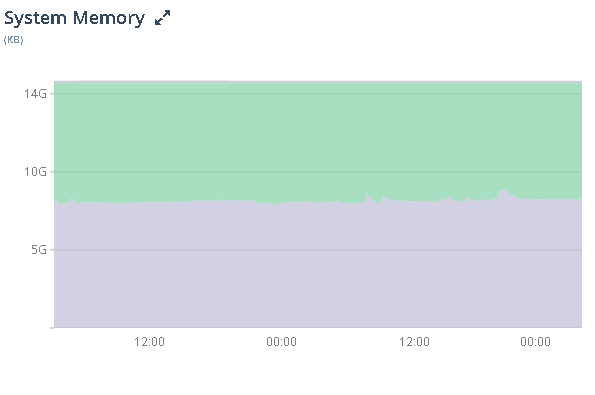
The System Memory chart helps you analyze how much free space, used, cached and buffers in your MongoDB® system memory to ensure your memory usage is in a healthy range of your capacity and avoid out-of-memory errors.
Disk
Disk storage is a critical resource for any scalable database system. The performance of your disk-based databases will depend on how data is managed on the disk. Learn more about understanding and managing disk space on your MongoDB® server.
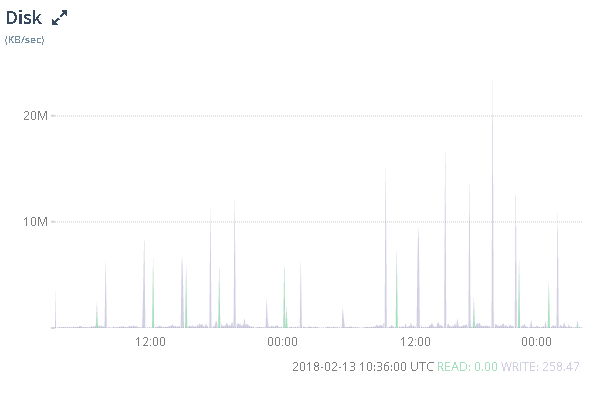
The disk chart outlines your total disk reads/second and total disk writes/second by KB/second.
Slow Query Analysis
Using the slow query analyzer, you can quickly identify slow queries on any of your servers over a particular period of time. By default, “slow queries” are defined as queries that take longer than 100ms.
- CMD: Command operations for your MongoDB queries.
- GetMore: Use in conjunction with commands that return a cursor, e.g., find and aggregate, to return subsequent batches of documents currently pointed to by the cursor (official MongoDB documentation).
- Delete: Queries that are deleted.
- Update: Queries that are updated.
- Query: The actual query with the query parameters removed.
- Insert: Queries that are inserted.

MongoDB® Memory
Your MongoDB® database files are memory-mapped and constitute most of your memory use.
Check your Mongo Memory chart for MongoDB® memory (RAM) usage:
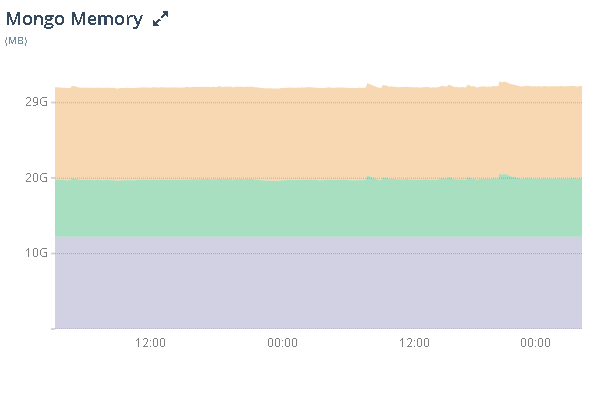
- Virtual (MB): Virtual memory of the MongoDB® process.
- Resident (MB): Resident memory of the MongoDB® process.
- Mapped (MB): MMAP memory (MMAPv1 only) - reflects data size.
- Non-Mapped (MB): Amount of virtual memory not used by MMAP files. High usage indicates a high number of connections to the database.
Mongo Network
MongoDB® process network usage:
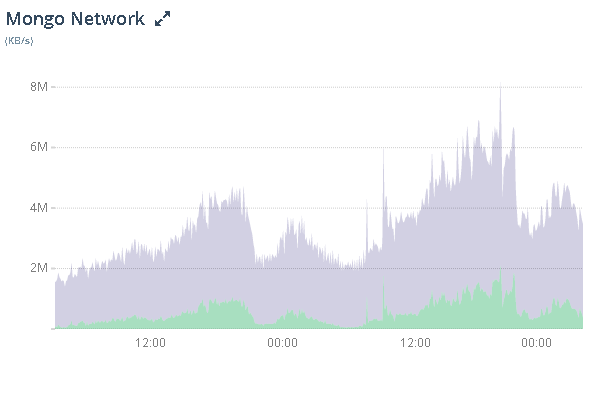
- KBYTES-IN (KB/s): Averages KBytes/sec sent into database server.
- KBYTES-OUT (KB/s): Averages KBytes/sec sent out from database server.
Connection
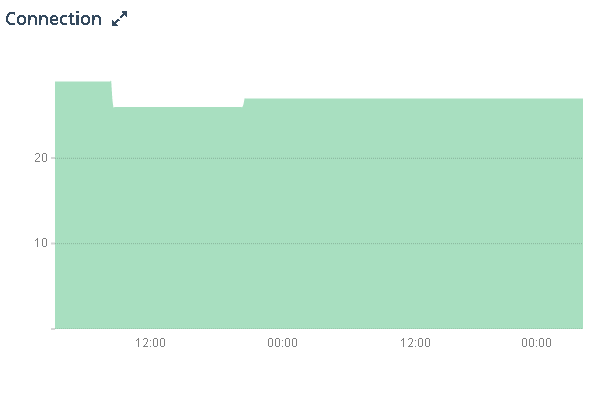
Check out your current active connections:
Tickets
Check out the tickets you have available:
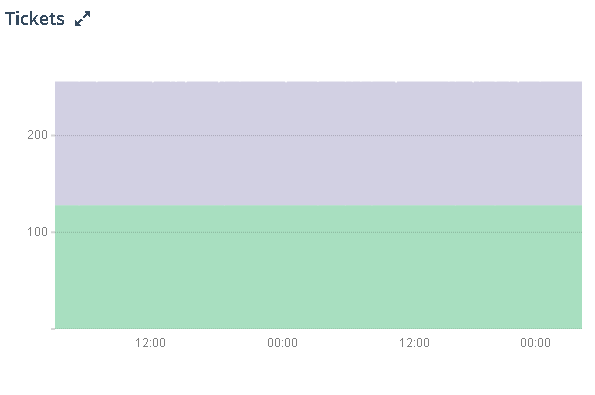
- READ: The number of read tickets available to the WiredTiger storage engine. Read tickets represent the number of concurrent read operations allowed into the storage engine. When this value reaches zero, new read requests may queue until a read ticket becomes available.
- WRITE: The number of write tickets available to the WiredTiger storage engine. Write tickets represent the number of concurrent write operations allowed into the storage engine. When this value reaches zero, new write requests may queue until a write ticket becomes available.
Cache Usage
Check out your cache usage:
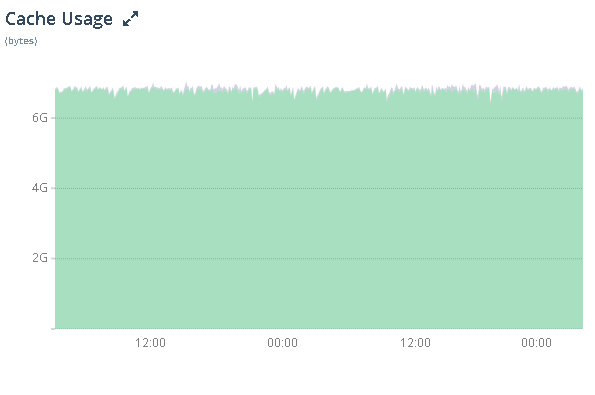
- Used (bytes): The number of bytes currently in the WiredTiger cache.
- Dirty (bytes): The number of tracked dirty bytes currently in the WiredTiger cache.
Cache Activity
Check out your MongoDB® cache activity:
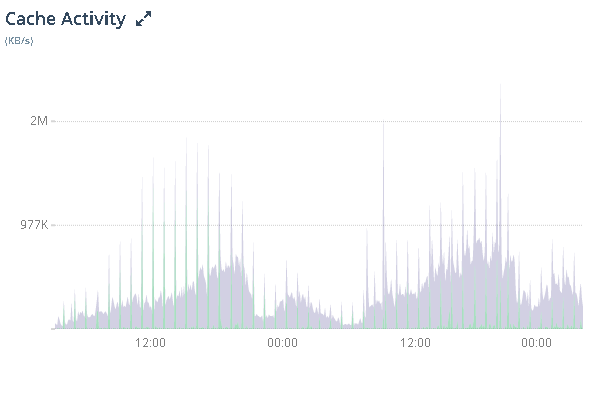
- Read-Into (KB/s): The average rate of bytes per second read into WiredTiger's cache over the selected sample period.
- Written-From (KB/s): The average rate of bytes per second written from WiredTiger's cache over the selected sample period.
Page Faults
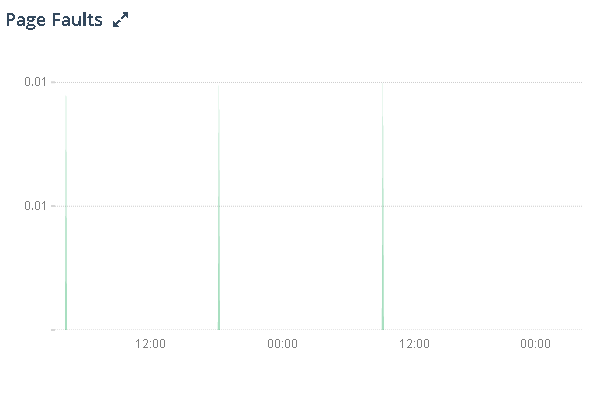
See your average faults per second:
Asserts
Monitor your Asserts:
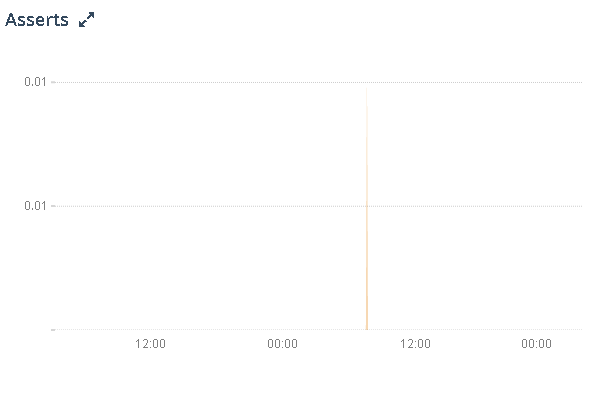
- Regular: Regular Asserts raised/sec.
- Warning: Warning Asserts raised/sec.
- Message: Message Asserts raised/sec.
- User: User Asserts raised/sec.
Cursors
Monitor your MongoDB® cursor usage:
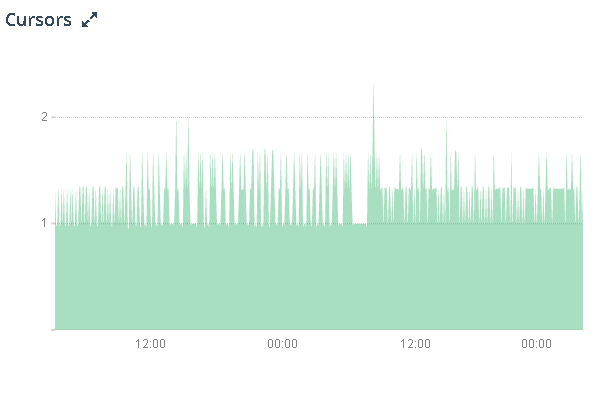
- Open: Total open cursors on the server.
- Timeout: Average timed out cursors/sec.
Queues
Monitor your MongoDB® queues:
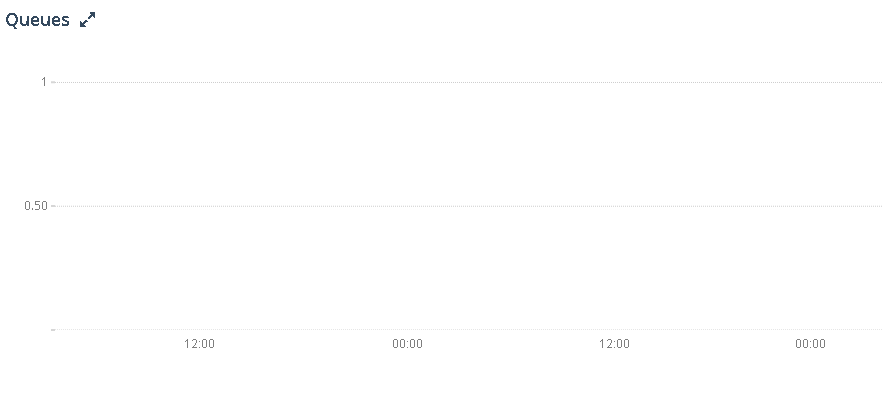
- Readers: Number of operations queued waiting for read-lock.
- Writers: Number of operations queued waiting for write-lock.
Replication Window Size
Monitor your replication Oplog window:
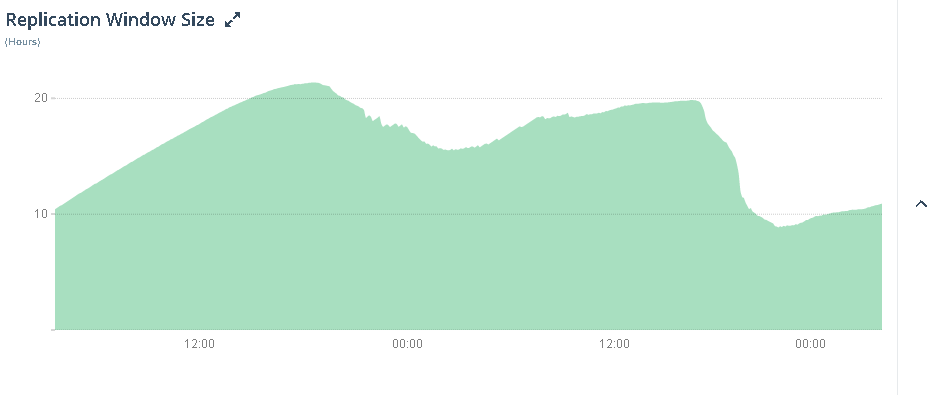
Replication Oplog window in hours. If the secondary falls behind by more than this, it will need to be resynced.
Updated 12 months ago
