Prometheus and Grafana for MySQL
Easily monitor your MySQL hosting deployments at ScaleGrid using a dynamic monitoring tool like Prometheus and create dashboards using Grafana to keep tabs on your database performance.
How to Setup Your MySQL Monitoring
Learn how to setup and start using Prometheus, MySQL Exporter, and Grafana from a central host running on Ubuntu to monitor multiple MySQL servers at ScaleGrid.
- Prometheus Server: Stores and displays your MySQL metrics.
- MySQL Exporter: Collects metrics from your MySQL deployment and relays them to the Prometheus server (can use any exporter for MySQL).
- Grafana: Used to create dashboards for your MySQL metrics.
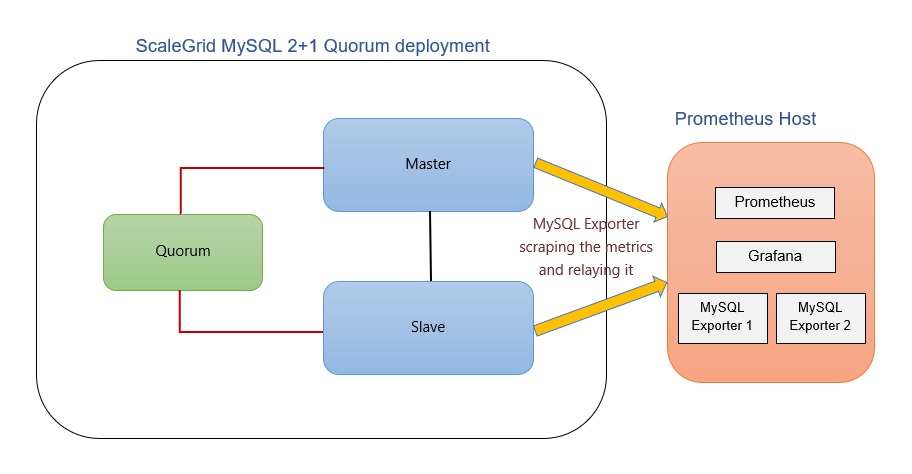
The block diagram below shows the setup of a master-slave-quorum MySQL deployment that includes two data-bearing nodes (master and slave) and one voting member (quorum) that leverages Prometheus, MySQL Exporter and Grafana:
Installing & Configuring the Prometheus Server
Prometheus is the tool used to centralize and store the metrics. It scrapes the metrics from one or several exporters at regular intervals and displays it on its UI. Below are the steps to install and configure Prometheus on a central Ubuntu host.
1. Create a Prometheus System Group & User
$sudo groupadd --system prometheus
$sudo useradd -s /sbin/nologin --system -g prometheus prometheus
2. Create a Data Directory for Prometheus
$sudo mkdir /var/lib/prometheus3. Create Configuration Directories for Prometheus
$for i in rules rules.d files_sd; do sudo mkdir -p /etc/prometheus/${i}; done4. Download the Prometheus Archive & Extract the File
To download the latest binary archive for Prometheus:
$mkdir -p /tmp/prometheus && cd /tmp/Prometheus
$curl -s https://api.github.com/repos/prometheus/prometheus/releases/latest \
  | grep browser_download_url \
  | grep linux-amd64 \
  | cut -d '"' -f 4 \
  | wget -qi -
To extract the file:
$tar xvf prometheus*.tar.gz
$cd prometheus*/
5. Move the Prometheus Files to Standard Locations
Move Prometheus binary files to /usr/local/bin:
$sudo mv prometheus promtool /usr/local/bin/Move Prometheus configuration template to /etc directory:
$sudo mv prometheus.yml /etc/prometheus/prometheus.ymlAlso move consoles and console_libraries to /etc/prometheus directory:
$sudo mv consoles/ console_libraries/ /etc/prometheus/6. Create/Edit a Prometheus Configuration File
$sudo vim /etc/prometheus/prometheus.ymlThe template configurations should look similar to below:
#my global config
	global:
	  scrape_interval:     15s # Set the scrape interval to every 15 seconds. Default is every 1 minute.
	  evaluation_interval: 15s # Evaluate rules every 15 seconds. The default is every 1 minute.
	  #scrape_timeout is set to the global default (10s).

	#Alertmanager configuration
	alerting:
	  alertmanagers:
	  - static_configs:
	    - targets:
	      #- alertmanager:9093

	#Load rules once and periodically evaluate them according to the global 'evaluation_interval'.
	rule_files:
	  #- "first_rules.yml"
	  #- "second_rules.yml"

	#A scrape configuration containing exactly one endpoint to scrape:
	#Here it's Prometheus itself.
	scrape_configs:
	  #The job name is added as a label `job=<job_name>` to any timeseries scraped from this config.
	  - job_name: 'prometheus'

	    #metrics_path defaults to '/metrics'
	    #scheme defaults to 'http'.

	    static_configs:
	    - targets: ['localhost:9090']
7. Create a Prometheus systemd Service Unit File
$cat /etc/systemd/system/prometheus.service

	[Unit]
	Description=Prometheus
	Documentation=https://prometheus.io/docs/introduction/overview/
	Wants=network-online.target
	After=network-online.target

	[Service]
	Type=simple
	Environment="GOMAXPROCS=1"
	User=prometheus
	Group=prometheus
	ExecReload=/bin/kill -HUP $MAINPID
	ExecStart=/usr/local/bin/prometheus \
	  --config.file=/etc/prometheus/prometheus.yml \
	  --storage.tsdb.path=/var/lib/prometheus \
	  --web.console.templates=/etc/prometheus/consoles \
	  --web.console.libraries=/etc/prometheus/console_libraries \
	  --web.listen-address=0.0.0.0:9090 \
	  --web.external-url=

	SyslogIdentifier=prometheus
	Restart=always

	[Install]
	WantedBy=multi-user.target
Remember to edit the line: Environment="GOMAXPROCS=1 by replacing 1 with the number of vcpus on your server.
8. Change Directory Permissions
Change the ownership of these directories to Prometheus user and group:
$for i in rules rules.d files_sd; do sudo chown -R prometheus:prometheus /etc/prometheus/${i}; done
$for i in rules rules.d files_sd; do sudo chmod -R 775 /etc/prometheus/${i}; done
$sudo chown -R prometheus:prometheus /var/lib/prometheus/
9. Reload systemd Daemon & Start the Service
$sudo systemctl daemon-reload
$sudo systemctl start prometheus
$sudo systemctl enable prometheus
Check status using systemctl status prometheus command:

10. Configure a Firewall to Open Port 9090
$sudo firewall-cmd --add-port=9090/tcp --permanent
$sudo firewall-cmd --reload
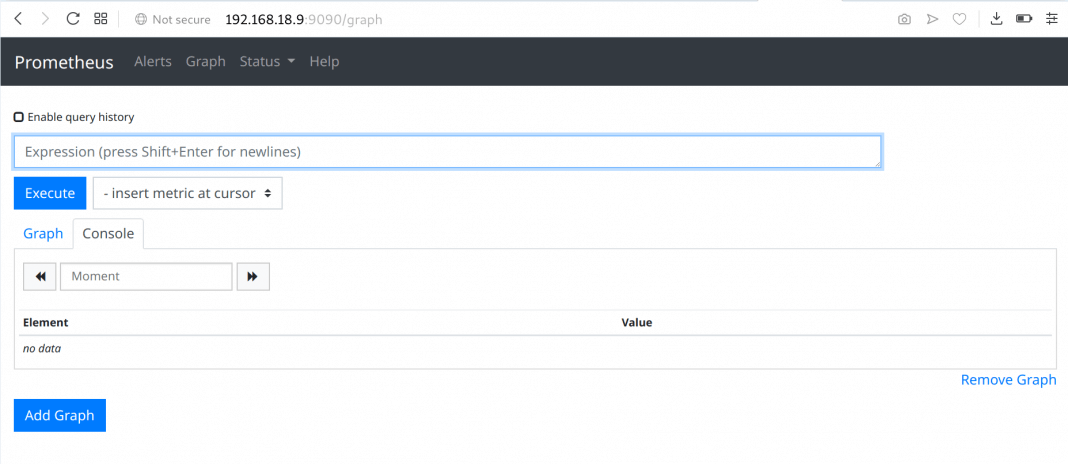
Once the setup is complete, you can access the Prometheus UI by logging in to http\://<PrometheusHostIP>:9090
Installing & Configuring MySQL Prometheus Exporter
Prometheus requires an exporter for collecting MySQL server metrics. This exporter can be run centrally on the Prometheus server or locally on the MySQL database server. For further reading, refer to this Prometheus documentation.
Follow the below steps to install and setup MySQL Prometheus Exporter on the central Prometheus host.
1. Download & Install Prometheus MySQL Exporter
$curl -s https://api.github.com/repos/prometheus/mysqld_exporter/releases/latest   | grep browser_download_url   | grep linux-amd64   | cut -d '"' -f 4   | wget -qi -
$tar xvf mysqld_exporter*.tar.gz
$sudo mv  mysqld_exporter-*.linux-amd64/mysqld_exporter /usr/local/bin/
$sudo chmod +x /usr/local/bin/mysqld_exporter
2. Create Prometheus Exporter Database User to Access the Database, Scrape Metrics & Provide Grants
CREATE USER 'mysqld_exporter'@'<PrometheusHostIP>' IDENTIFIED BY 'StrongPassword' WITH MAX_USER_CONNECTIONS 2;
GRANT PROCESS, REPLICATION CLIENT, SELECT ON *.* TO 'mysqld_exporter'@'<PrometheusHostIP>';
FLUSH PRIVILEGES;
EXIT
WITH MAX_USER_CONNECTIONS 2 is used to set a max connection limit for the user to avoid overloading the server with monitoring scrapes under heavy load.
3. Configure the Database Credentials
$sudo vim /etc/.mysqld_exporter.cnfAdd the username and password of the user created and the ScaleGrid MySQL server you want to monitor.
[client]
user=mysqld_exporter
password=StrongPassword
host=SG-mysqltestcluster-123456.servers.mongodirector.com
Set ownership permissions:
$sudo chown root:prometheus /etc/.mysqld_exporter.cnf4. Create systemd Unit File
Create a new service file:
$sudo vim /etc/systemd/system/mysql_exporter.serviceAdd the following content:
[Unit]
	Description=Prometheus MySQL Exporter
	After=network.target
	User=prometheus
	Group=prometheus

	[Service]
	Type=simple
	Restart=always
	ExecStart=/usr/local/bin/mysqld_exporter \
	--config.my-cnf /etc/.mysqld_exporter.cnf \
	--collect.global_status \
	--collect.info_schema.innodb_metrics \
	--collect.auto_increment.columns \
	--collect.info_schema.processlist \
	--collect.binlog_size \
	--collect.info_schema.tablestats \
	--collect.global_variables \
	--collect.info_schema.query_response_time \
	--collect.info_schema.userstats \
	--collect.info_schema.tables \
	--collect.perf_schema.tablelocks \
	--collect.perf_schema.file_events \
	--collect.perf_schema.eventswaits \
	--collect.perf_schema.indexiowaits \
	--collect.perf_schema.tableiowaits \
	--collect.slave_status \
	--web.listen-address=0.0.0.0:9104

	[Install]
	WantedBy=multi-user.target
--web.listen-address=0.0.0.0:9104 specifies that the server is listening on port 9104. If your server has a public and private network, you may need to replace 0.0.0.0:9104 with private IP, for example – 192.168.4.5:9104.
When done, reload systemd and start mysql_exporter service:
$sudo systemctl daemon-reload
$sudo systemctl enable mysql_exporter
$sudo systemctl start mysql_exporter
5. Configure MySQL Endpoint to be Scraped by Prometheus
Make changes like below to the prometheus.yml file:
scrape_configs:
	  - job_name: mysql_server1
	    static_configs:
	      - targets: ['localhost:9104']
	        labels:
alias: db1Note: If the exporter is not running on the same host as Prometheus, provide the IP address of the server instead of localhost. 9104 refers to the port Prometheus listens to, as specified in the previous step.
Monitoring Multiple MySQL Hosts From a Central Prometheus Host
Multiple MySQL servers can be monitored from a central server. This can be achieved by having a separate exporter service for each server. Create .mysqldexporter.cnf and mysql_exporter.service (with unique port numbers assigned to the --web.listen-address flag) files for each service as mentioned instep 3 and step 4 above. Add targets to the prometheus.yml file as mentioned in step 5 above. Job names should be _unique for each target. For example:
scrape_configs:
	  - job_name: mysql_server1
	    static_configs:
	      - targets: ['localhost:9104']
	        labels:
	          alias: db1
	  - job_name: mysql_server2
	    static_configs:
	      - targets: ['localhost:9105']
	        labels:
	          alias: db2
	  - job_name: mysql_server3
	    static_configs:
	      - targets: ['localhost:9106']
	        labels:
alias: db3Note: Prometheus Server should be able to reach the targets over the network. Ensure that your network/firewall configurations have been modified accordingly.
Installing Grafana & Creating Dashboards
Grafana uses Prometheus as a data source and lets you create dashboards which help you visualise and understand your metrics better. It provides a great way to gain insight into your time series data.
Follow the below steps to install Grafana on your central Prometheus host.
1. Download the Latest Grafana Version
Go the the Download Grafana page to download the latest version.
$wget <debian package url>
$sudo apt-get install -y adduser libfontconfig1
$sudo dpkg -i grafana_<version>_amd64.deb
2. Download APT Repository & Install Grafana
The command add-apt-repository isn’t a default app on Debian 9 and requires:
$apt-get install -y software-properties-commonInstall the repository for stable releases:
$sudo add-apt-repository "deb https://packages.grafana.com/oss/deb stable main"There is a separate repository if you want beta releases:
$sudo add-apt-repository "deb https://packages.grafana.com/oss/deb beta main"Use the above line even if you are on Ubuntu or another Debian version. Then add the gpg key. This allows you to install signed packages.
$wget -q -O - https://packages.grafana.com/gpg.key | sudo apt-key add -Update your Apt repositories and install Grafana:
$sudo apt-get update
$sudo apt-get install grafana
3. Start the Service
$systemctl daemon-reload
$systemctl start grafana-server
$systemctl status grafana-server
Enable the systemd service so that Grafana starts at boot.
$sudo systemctl enable grafana-server.serviceTo run Grafana open your browser and go to http\://<PrometheusHostIP>:3000/. 3000 is the http port that Grafana listens to by default.
4. Adding a Data Source
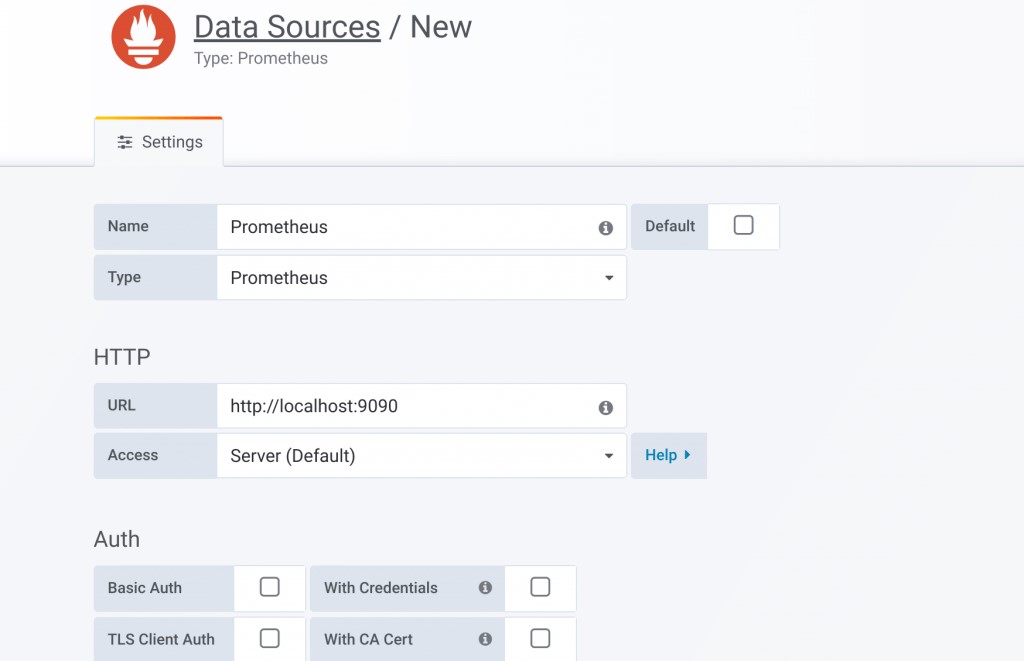
When installed, login to admin dashboard and add Datasource by navigating to Configuration > Data Sources.
Name: Prometheus
Type: Prometheus
URL: http://localhost:9090
Note: If Prometheus server is not running on the same host as Grafana, provide the IP address of the server instead of localhost.
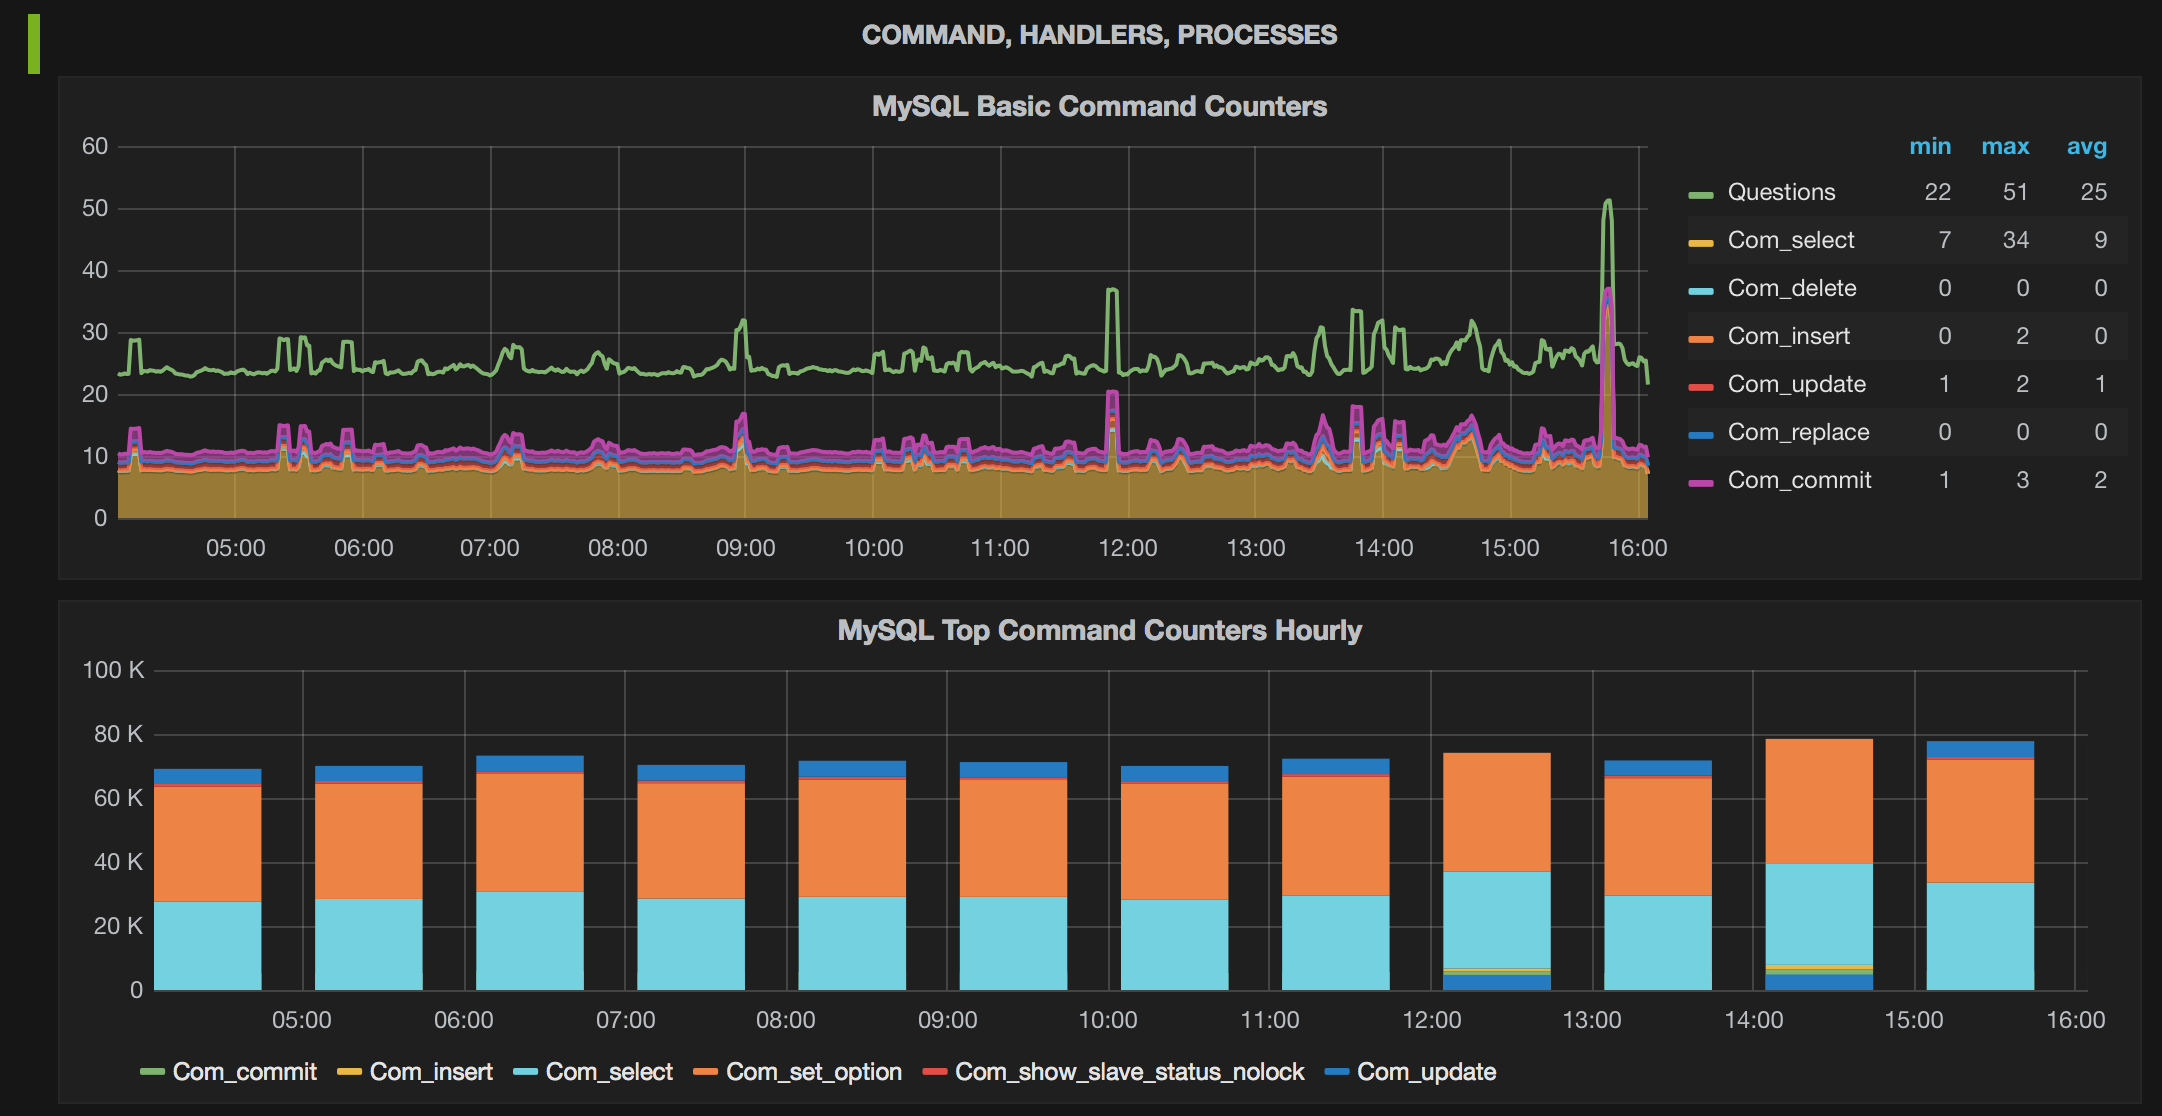
Now you are all set to create and customise your dashboards for MySQL monitoring at ScaleGrid. You can create a new dashboard by clicking on the link on the right side of the dashboard picker. Once the dashboard is created, you can add panels choosing the metrics to be displayed, star the dashboard, save and share it. For detailed instructions, you can refer the Grafana Getting Started documentation.
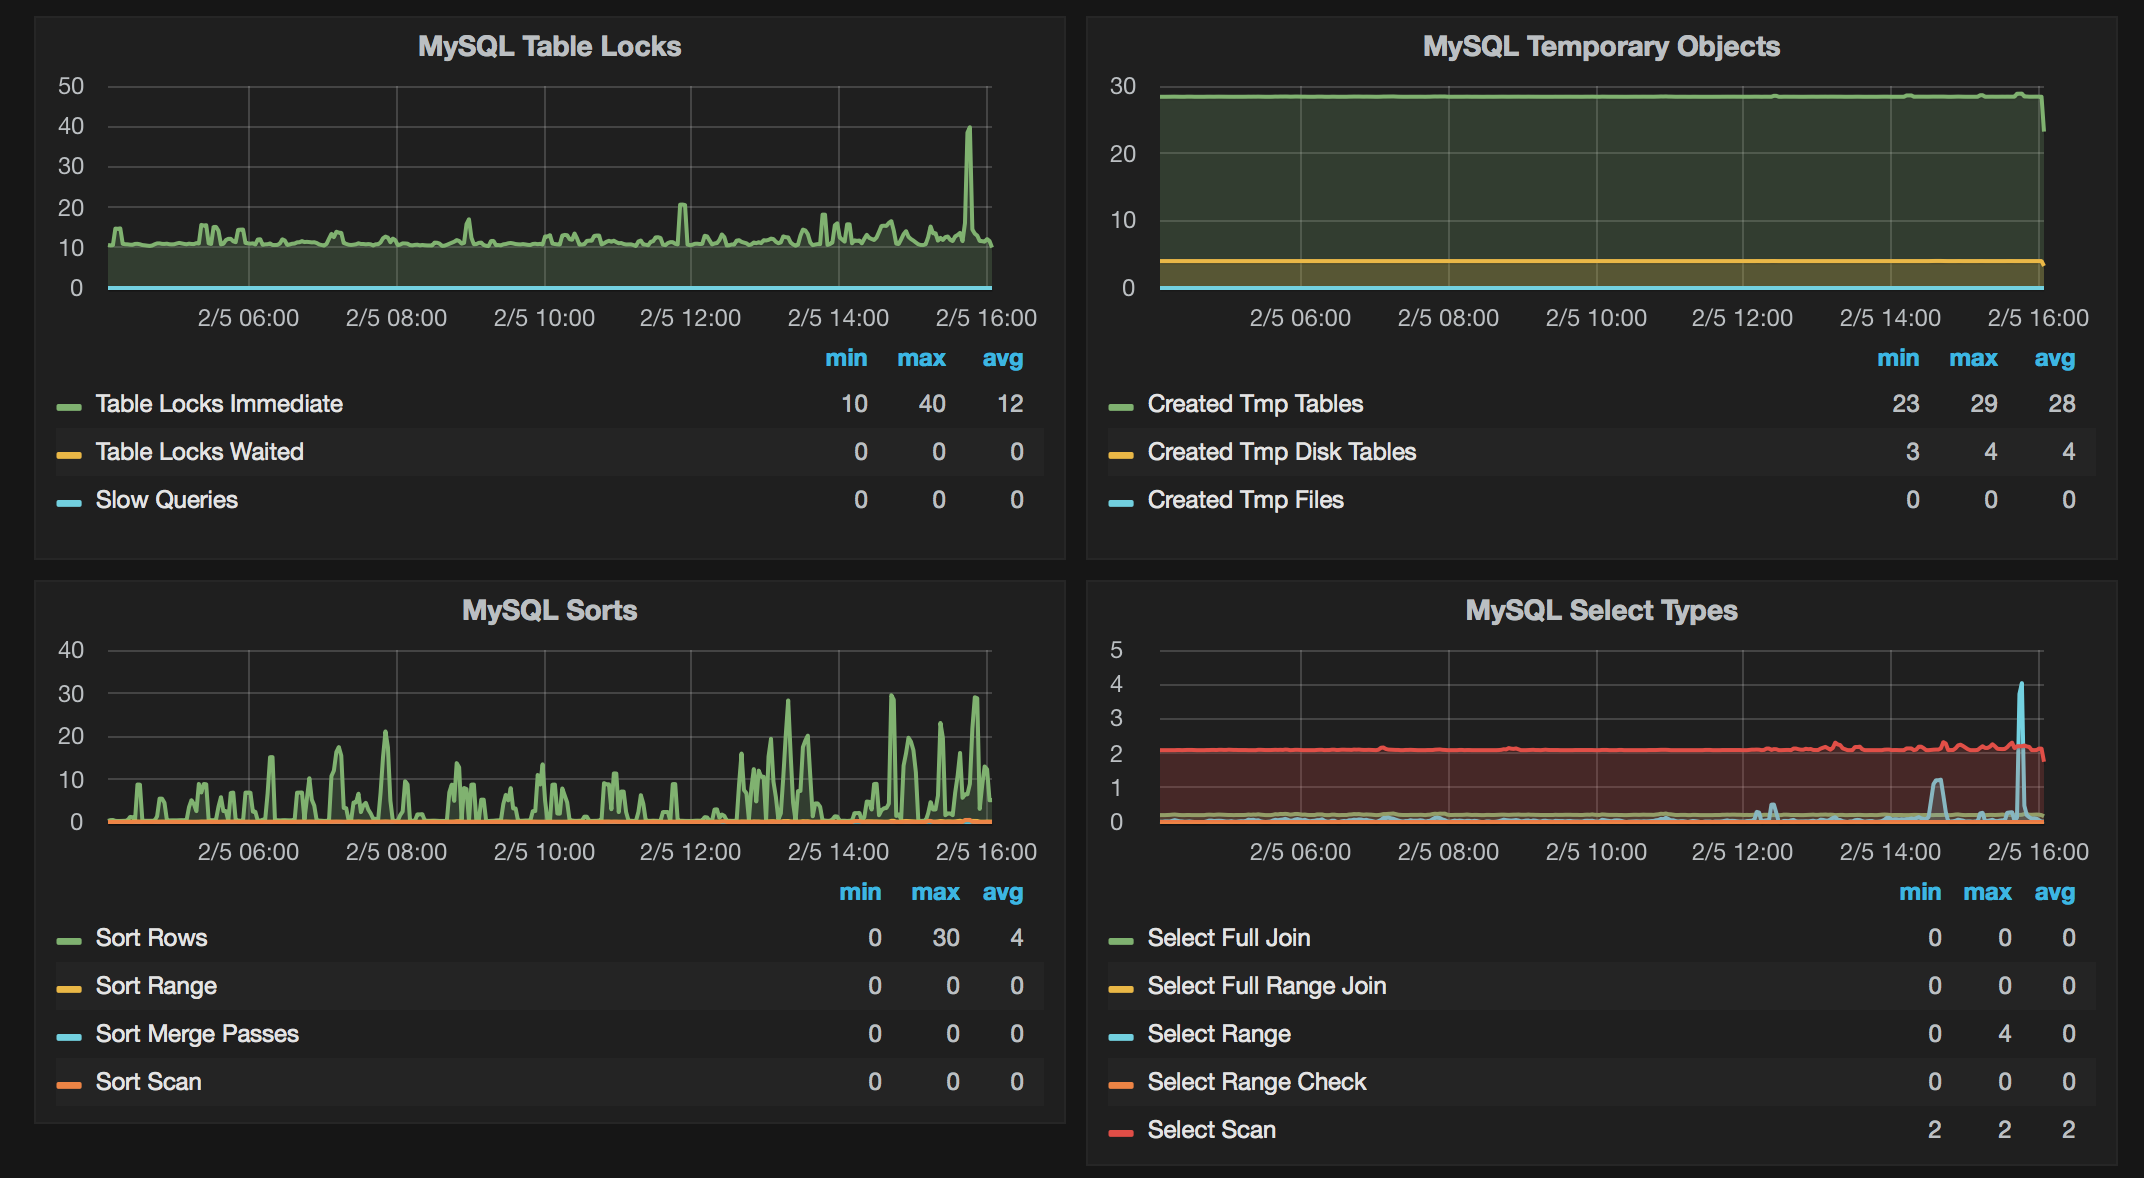
Here’s how sample Grafana dashboards would appear:
We are always looking to make our users lives easier, so let us know of any other tools you’d like to connect to your ScaleGrid deployments through our comments or via Twitter at @scalegridio.
Updated 12 months ago
