MySQL Overview Metrics
Analyze your MySQL hosting metrics with ScaleGrid DBaaS, including queries, connections, network, threads, cache, tables, objects, and handler activity on your clusters Monitoring Console.
ScaleGrid MySQL hosting and database management solutions come with advanced monitoring metrics to help ensure the continuous health of your deployments. Each cluster comes with it's own unique MySQL Monitoring Console found on your cluster details page.
Click on your Monitoring icon to get started:
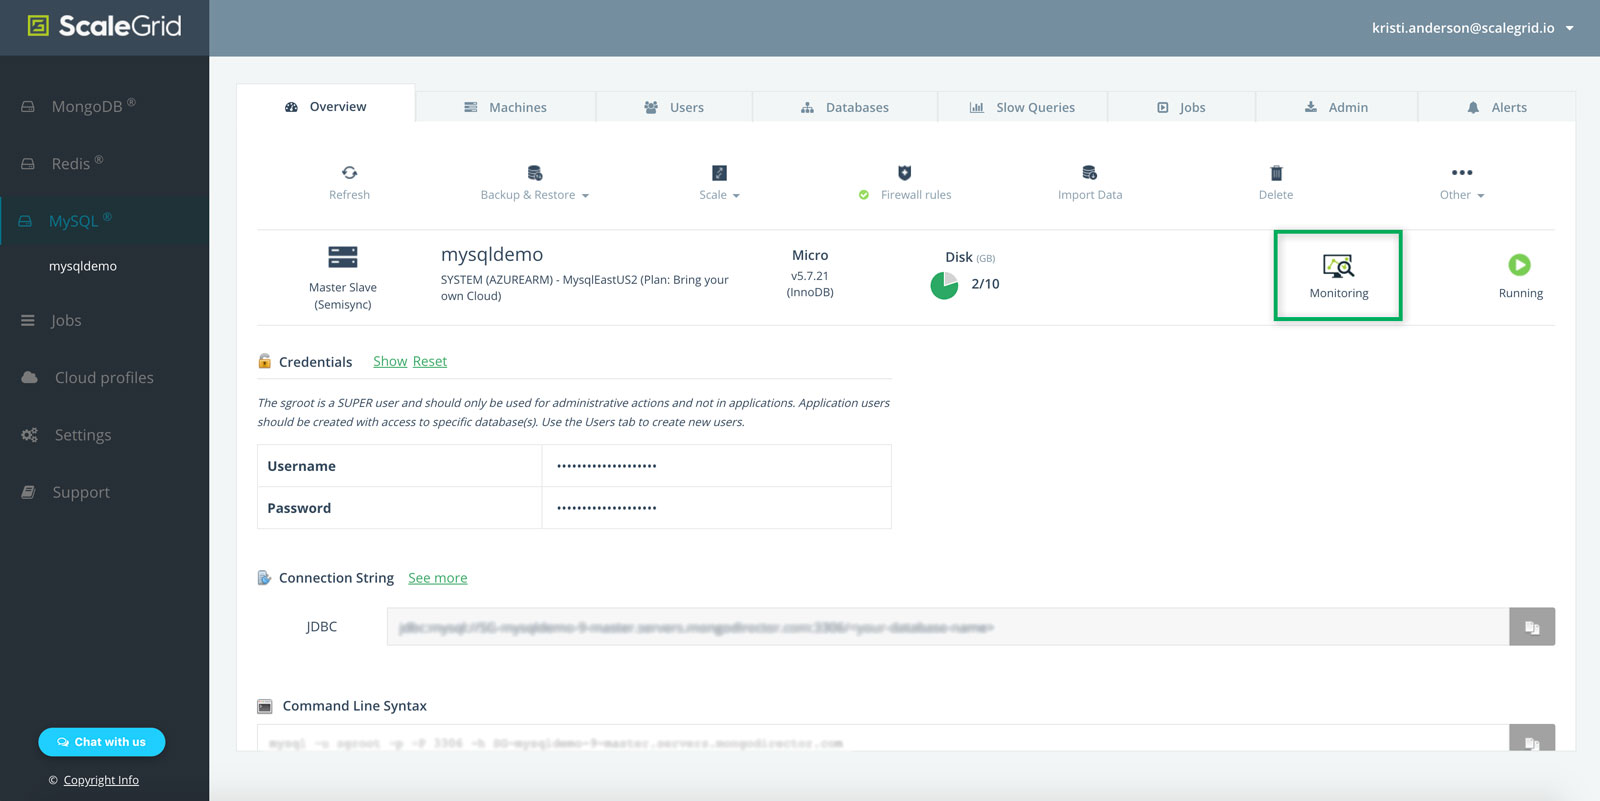
MySQL Hosting Overview Metrics
In this help doc, we're going to walk you through all of the MySQL metrics under the Overview tab of your Monitoring Console.
Find Your Other MySQL Deployment MetricsMySQL Operating System Metrics
MySQL InnoDB Metrics
MySQL Replication Metrics
At the top of your MySQL Monitoring Console, you can use the dropdown menus to change the view for your MySQL master vs. slave(s), time period, and time zone.
You can also click the green Compare Servers link to analyze how your master and slave(s) perform side-by-side for any given time range.
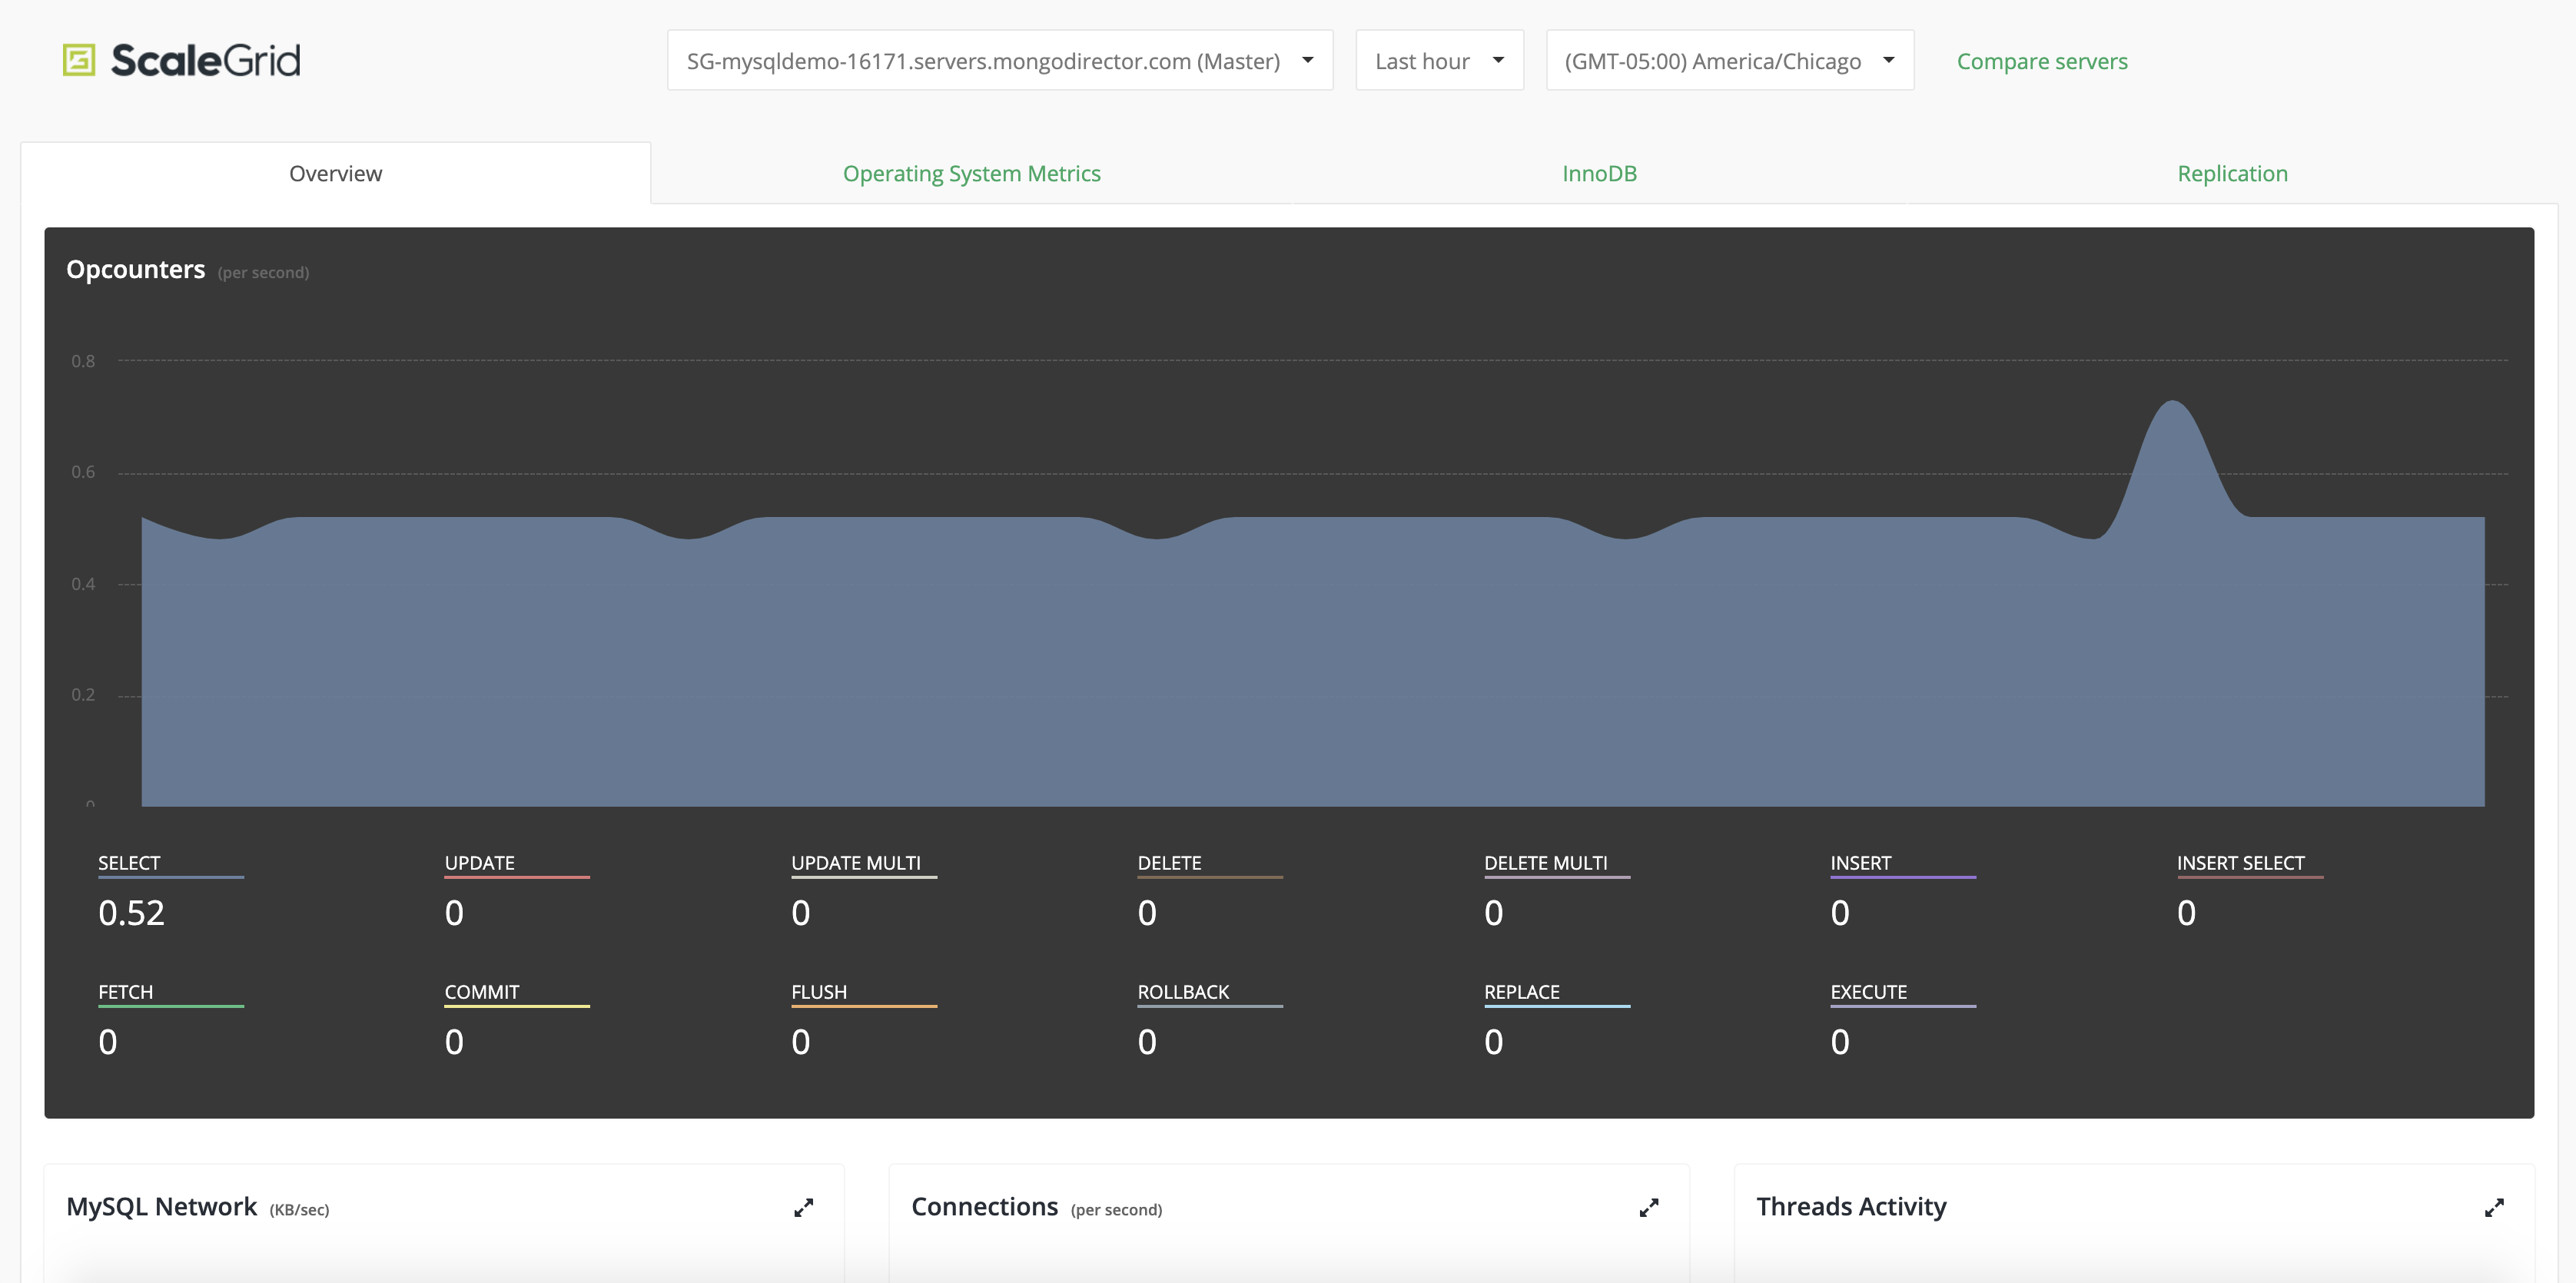
Chart AnnotationsSERVER ROLE CHANGE
Indicates that the role (Primary/Secondary/Master/Slave) of the Server instance changedSERVER RESTART
Indicates that the Server process restarted
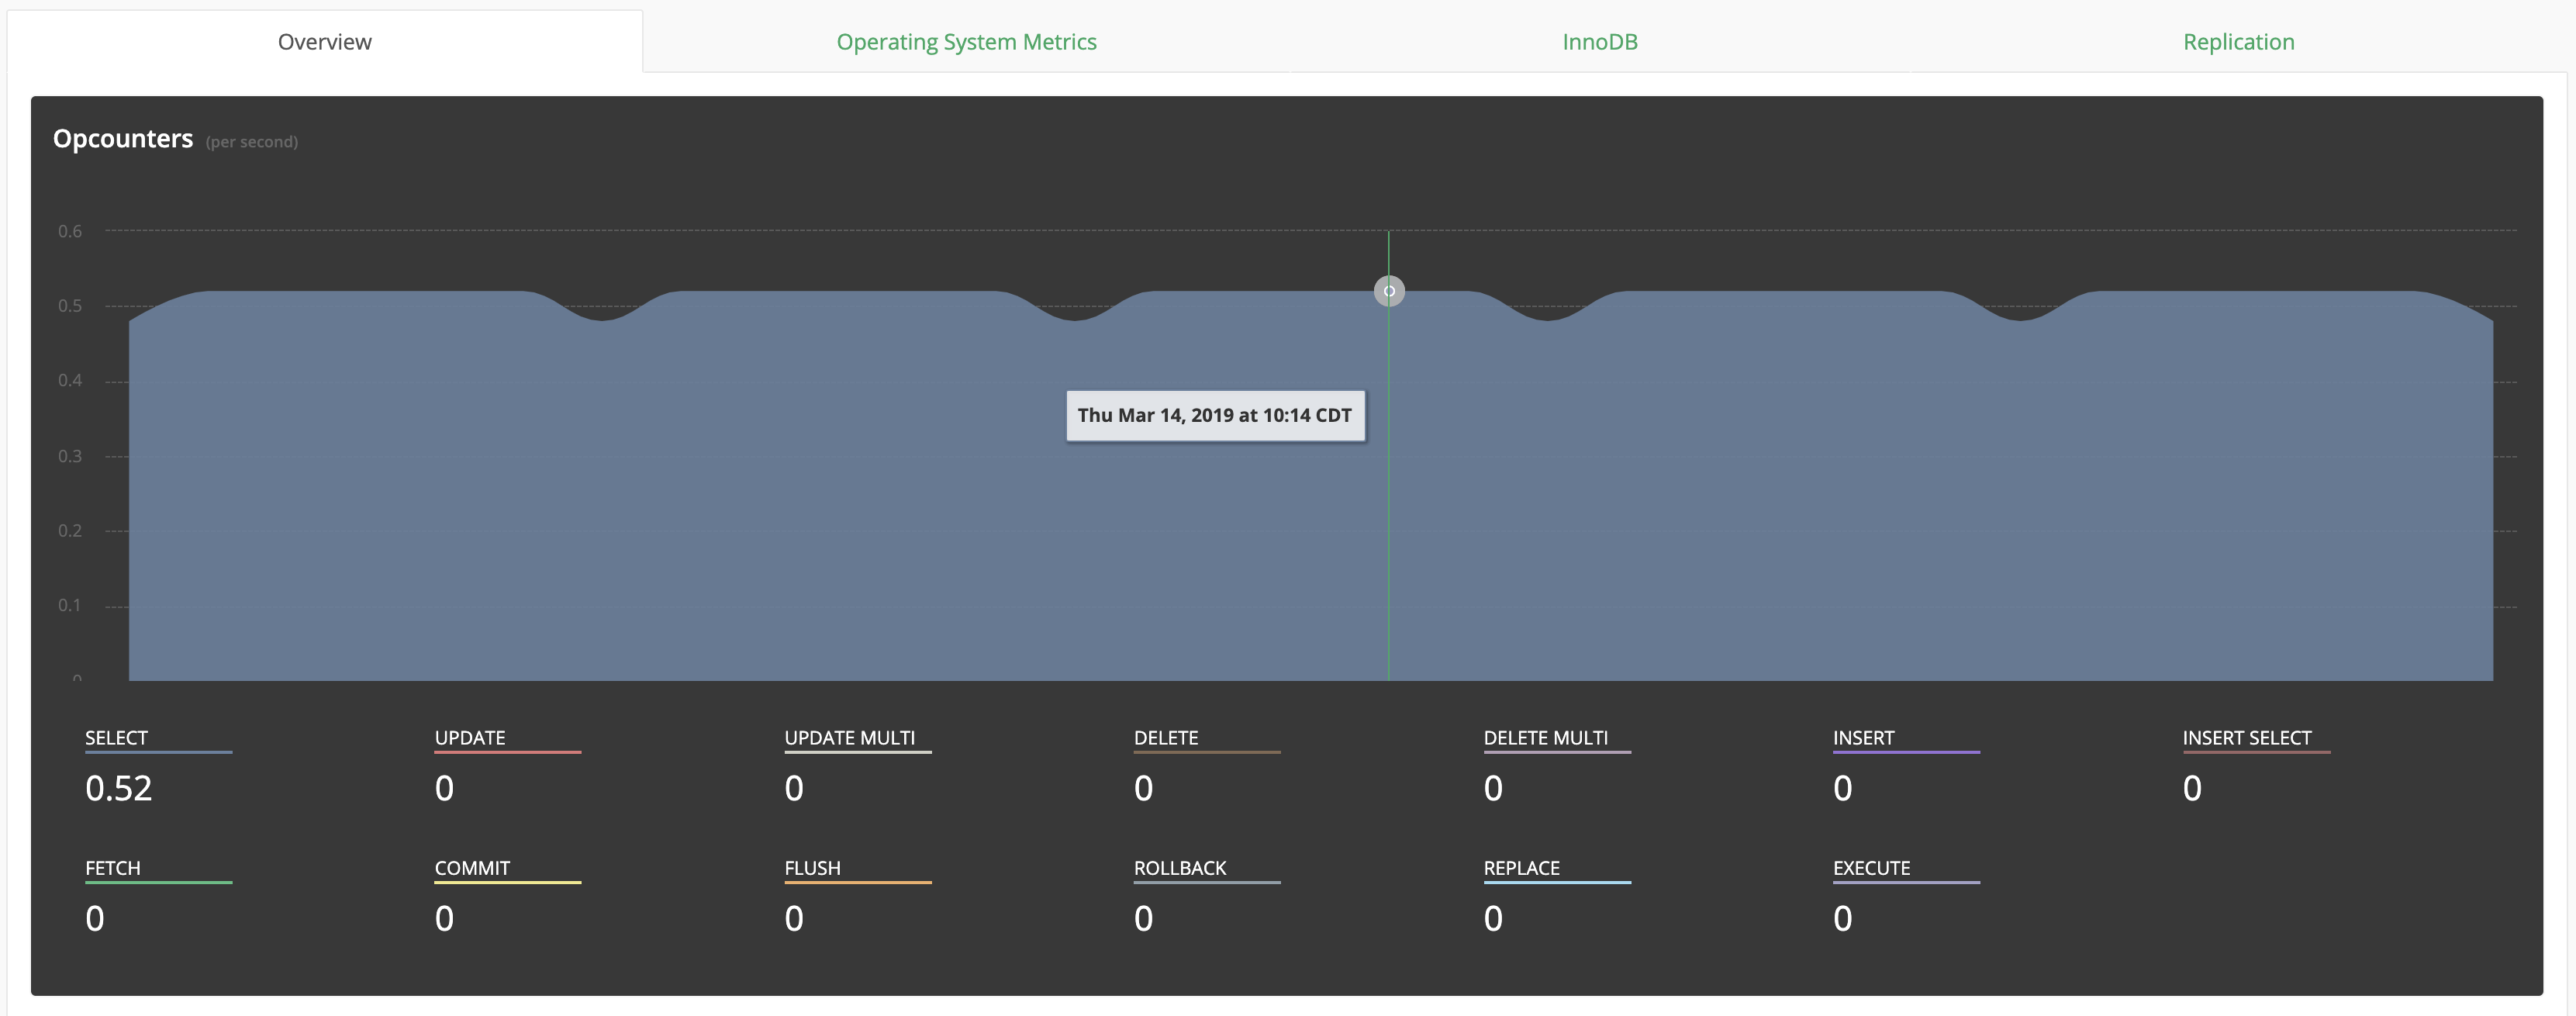
MySQL Opscounter
- SELECT: Number of MySQL selects/sec
- UPDATE: Number of MySQL updates/sec
- UPDATE MULTI: Number of MySQL multiple updates/sec
- DELETE: Number of MySQL deletes/sec
- DELETE MULTI: Number of MySQL multiple deletes/sec
- INSERT: Number of MySQL inserts/sec
- INSERT SELECT: Number of MySQL insert selects/sec
- FETCH: Number of MySQL fetches/sec
- COMMIT: Number of MySQL commits/sec
- FLUSH: Number of MySQL flushes/sec
- ROLLBACK: Number of MySQL rollbacks/sec
- REPLACE: Number of MySQL replaces/sec
- EXECUTE: Number of MySQL executes/sec
MySQL Network Usage
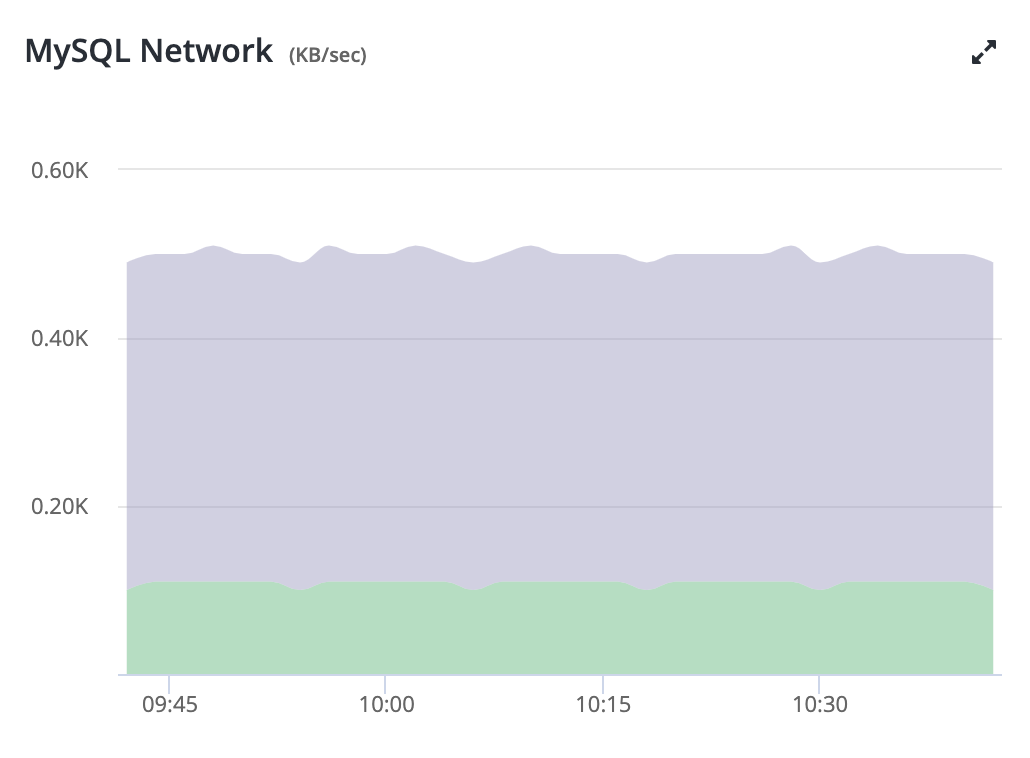
Use the MySQL Network chart (in KB/sec) to analyze your MySQL network usage:
- Network Inbound (KB/sec): Inbound Network usage/sec (green)
- Network Outbound (KB/sec): Outbound Network usage/sec (purple)
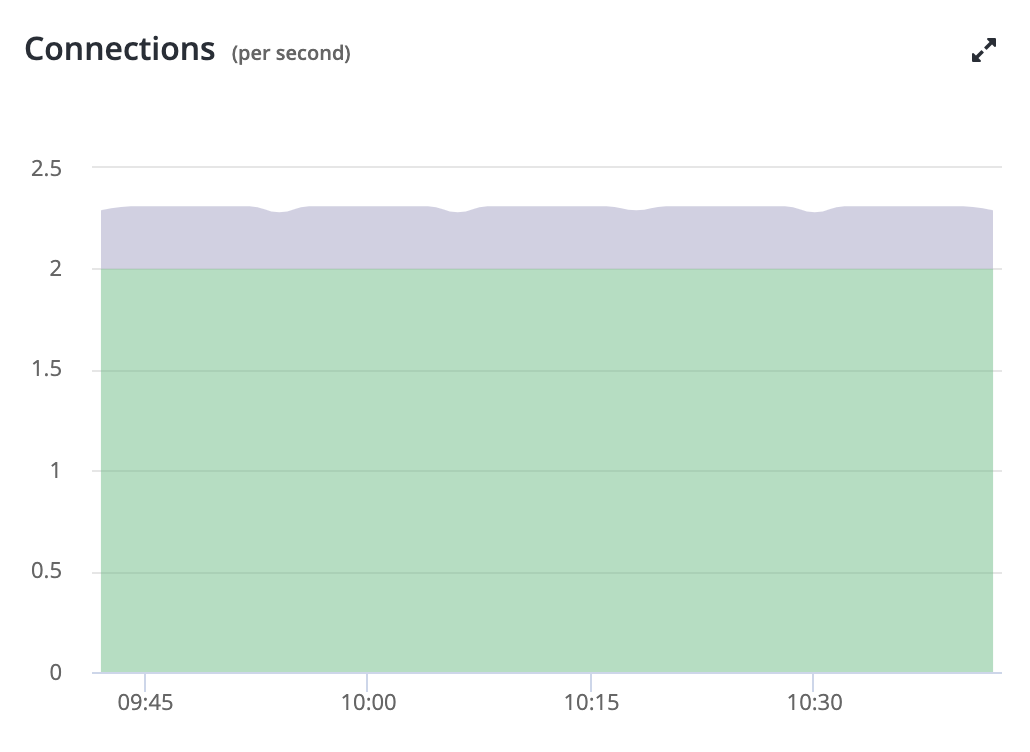
Current Connections
Connections (per second) helps you identify your current MySQL connections info:
- Threads Connected: Currently open connections (green)
- Connections (per second): The rate of connection attempts (successful or not) to the MySQL server (purple)
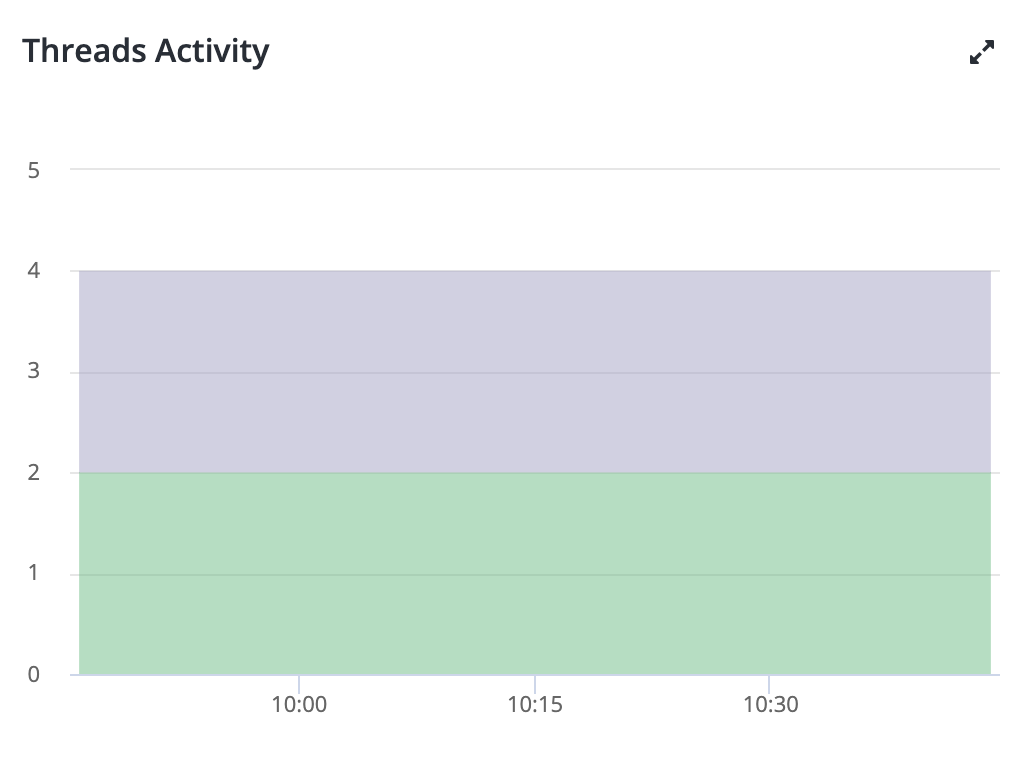
MySQL Threads Activity
Analyze your MySQL Threads Activity metrics:
- Threads Connected: Currently open connections (green)
- Threads Running: Number of threads not sleeping (purple)
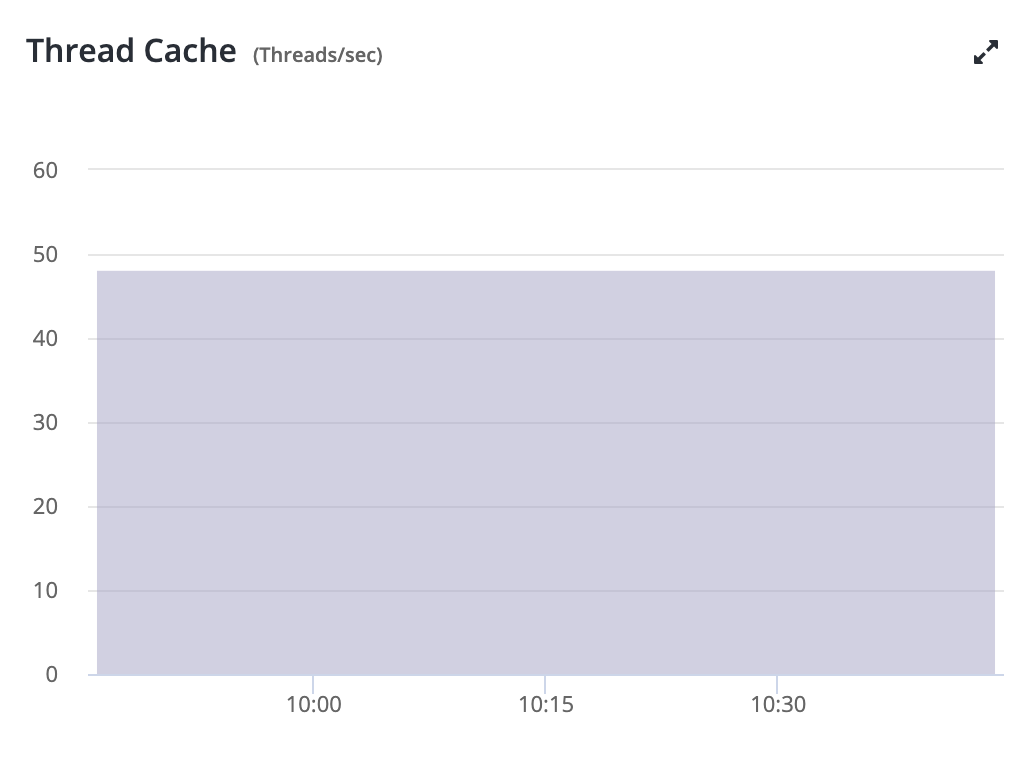
Thread Cache Statistics
See your MySQL Thread Cache statistics:
- Threads Created (Threads/sec): Number of threads created to handle connections (green)
- Threads Cached: Number of threads waiting to be reused in the thread cache (purple)
Aborted Connections
Identify your MySQL Aborted Clients (timeouts) & Connections (attempts):
- Aborted Connection (attempts): The number of failed attempts to connect to the MySQL server (green)
- Aborted Clients (timeouts): The number of connections that were aborted because the client died without closing the connection properly (purple)
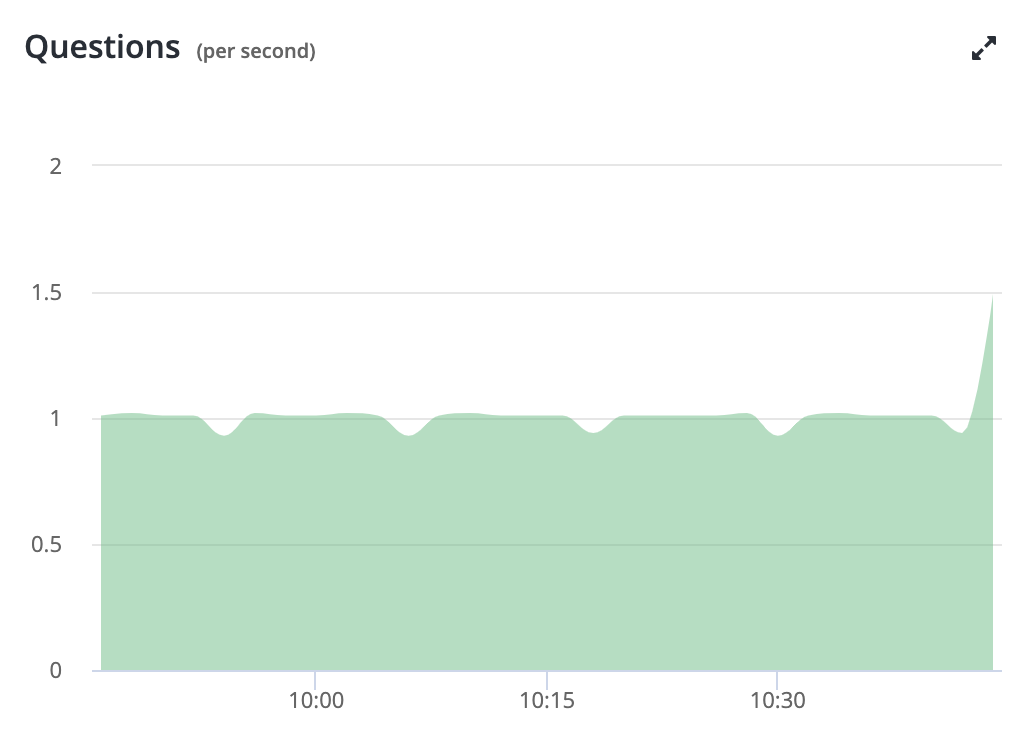
MySQL Questions Metrics
MySQL Questions (per second):
- Total Operations: Number of statements executed by the server/sec (green)
- Slow Queries: The rate of queries that have taken more than long_query_time seconds (purple)
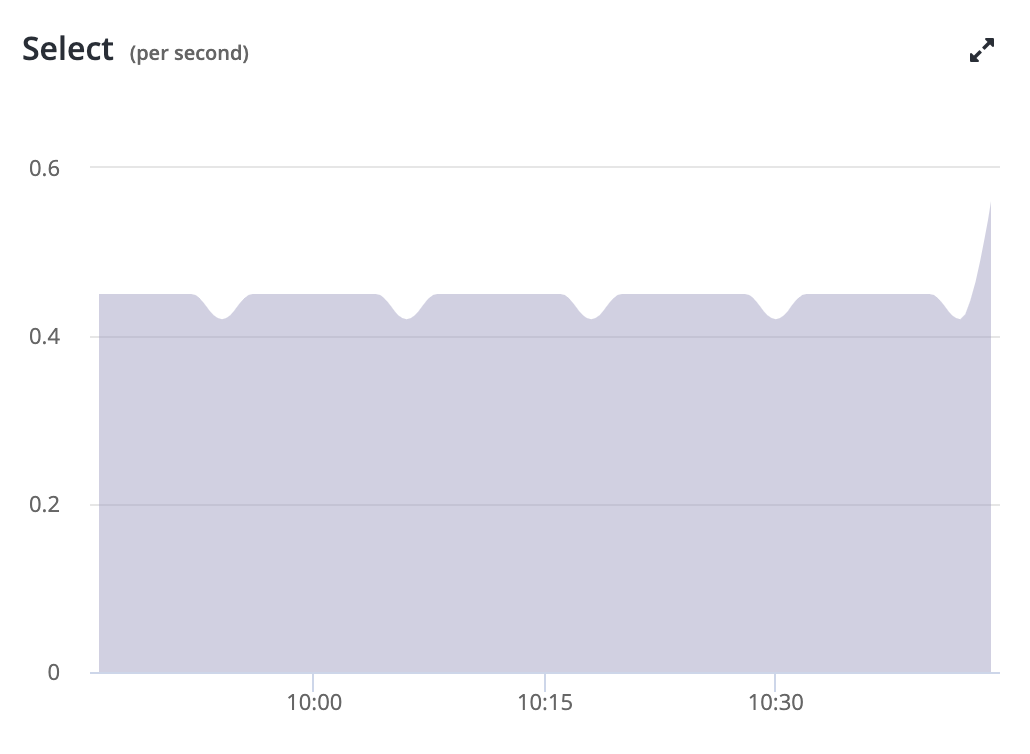
MySQL Select Metrics
Select (per second):
- Select Scan: Number of joins that did full scan on first table/sec (purple)
- Select Full Join: Number of join that did table scans due to no indexing/sec (green)
- Select Range: Number of joins that used ranges on the first table/sec (grey)
- Select Range Check: Number of joins without keys that check key usage after each row/sec (orange)
MySQL Sort Metrics
MySQL Sort (per second):
- Sort Scan: Number of sorts that were done by scanning the table/sec (purple)
- Sort Range: Number of sorts that were done using ranges/sec (green)
- Sort Rows: Number of sorted rows/sec (grey)
- Sort Merge: Number of merge passes that sort algorithm had to do/sec (orange)
Handler Activity Status
Status of the MySQL Handler layer (per second):
- Commit: Number of commit operations executed by storage engine/sec (purple)
- Prepare: Number of prepare operations executed by storage engine/sec (blue)
- Rollback: Number of rollback operation executed by storage engine/sec (grey)
- SavePoint: Number of savepoint operation executed by storage engine/sec (orange)
- SavePoint Rollback: Number of rollbacks upto a save point executed by storage engine/sec (green)
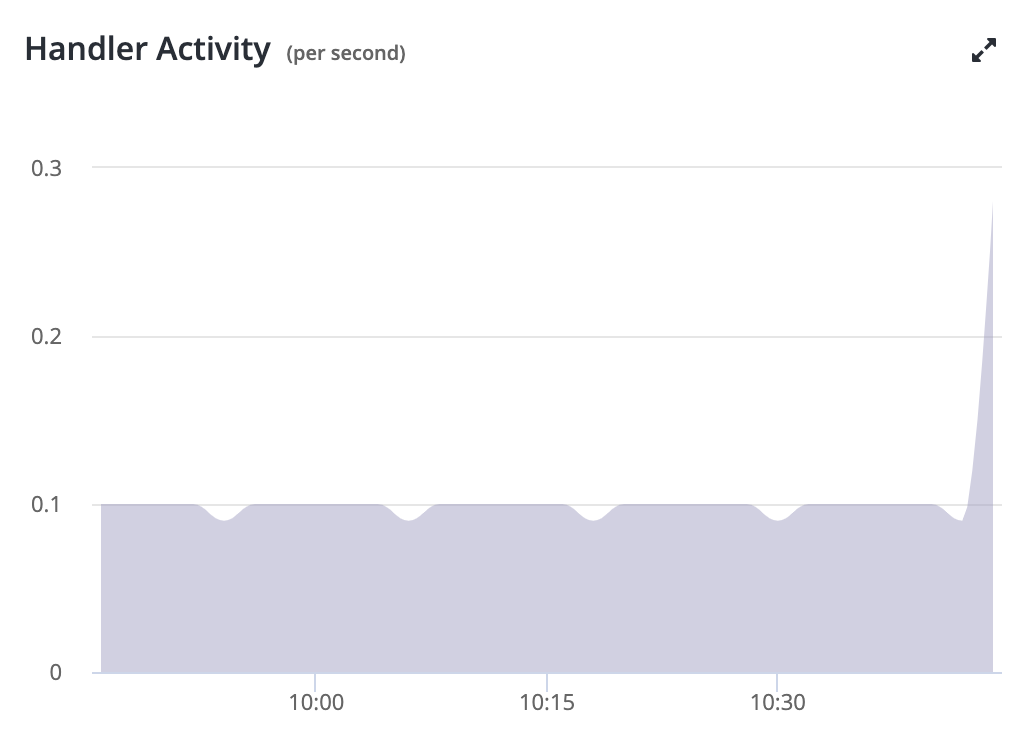
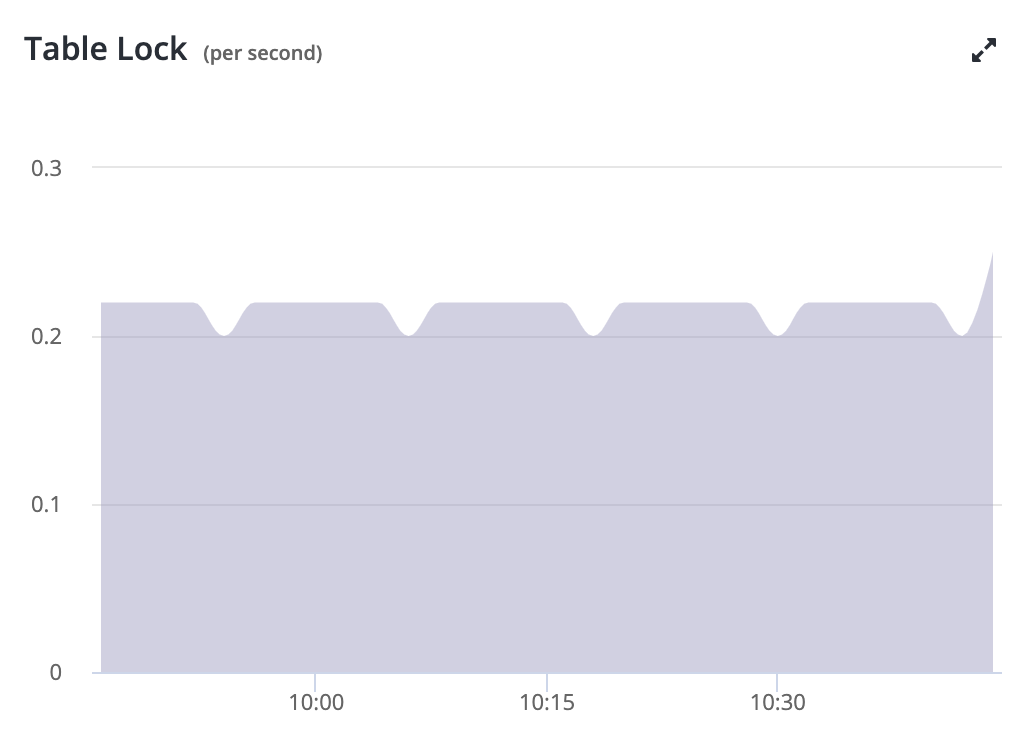
Table Lock
Table Lock (per second):
- Waited: Number of table lock requests waited/sec (green)
- Immediate: Number of Table lock requests granted immediately/sec (purple)
Temp Objects
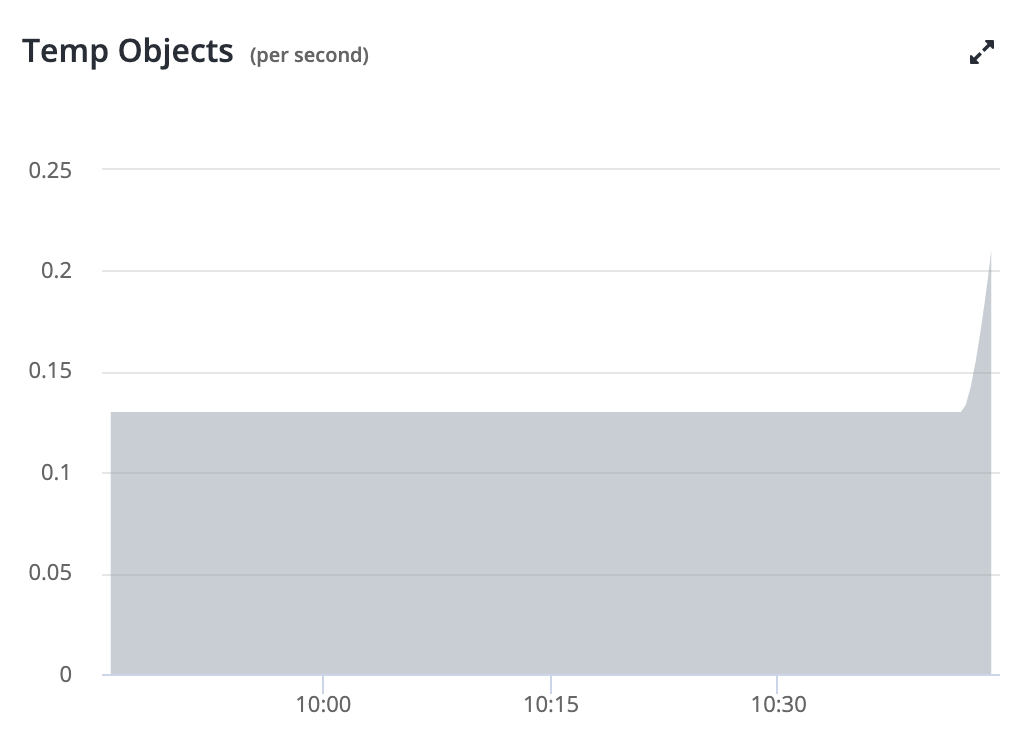
Temp Objects (per second) contains the details of temporary artifacts created by the MySQL server:
- Tables: Number of temp tables mysqld created/sec (grey)
- Files: Number of temp files mysqld created/sec (orange)
- Disk Tables: Number of internal on-disk temp tables mysqld created/sec (green)
Open Files Metrics
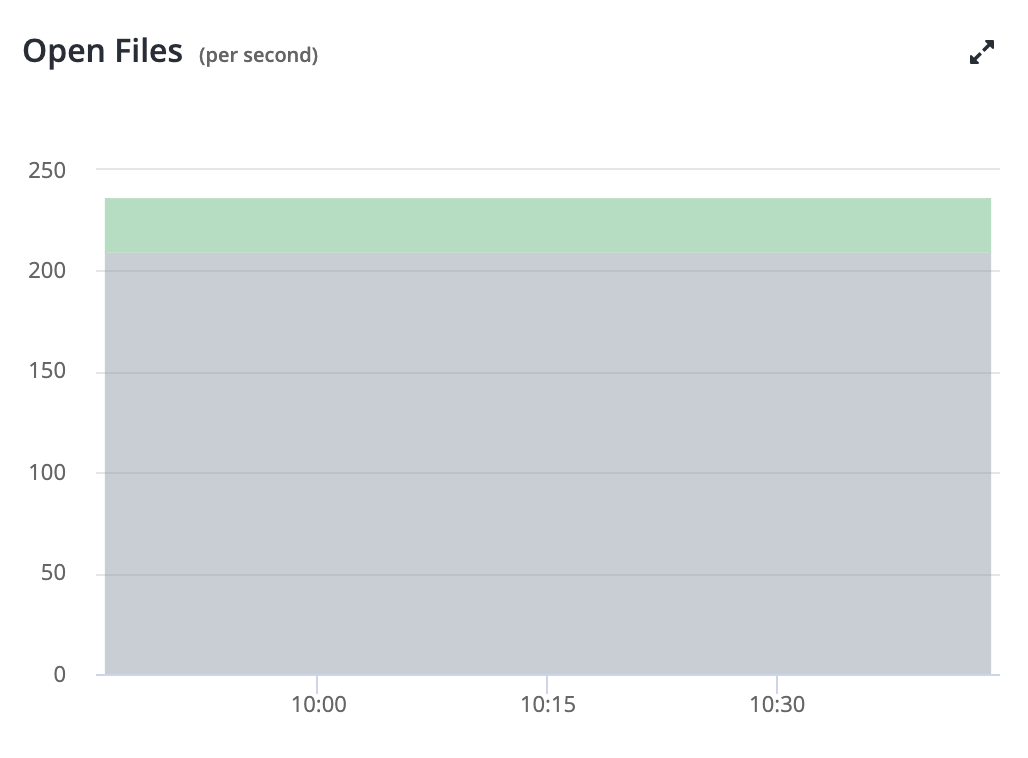
Open Files metrics related to files opened by MySQL server:
- Open: Number of files that are open (grey)
- Opened: Number of files opened/sec (orange)
- InnoDB Open: Number of files InnoDb currently holds open (green)
Open Tables Metric
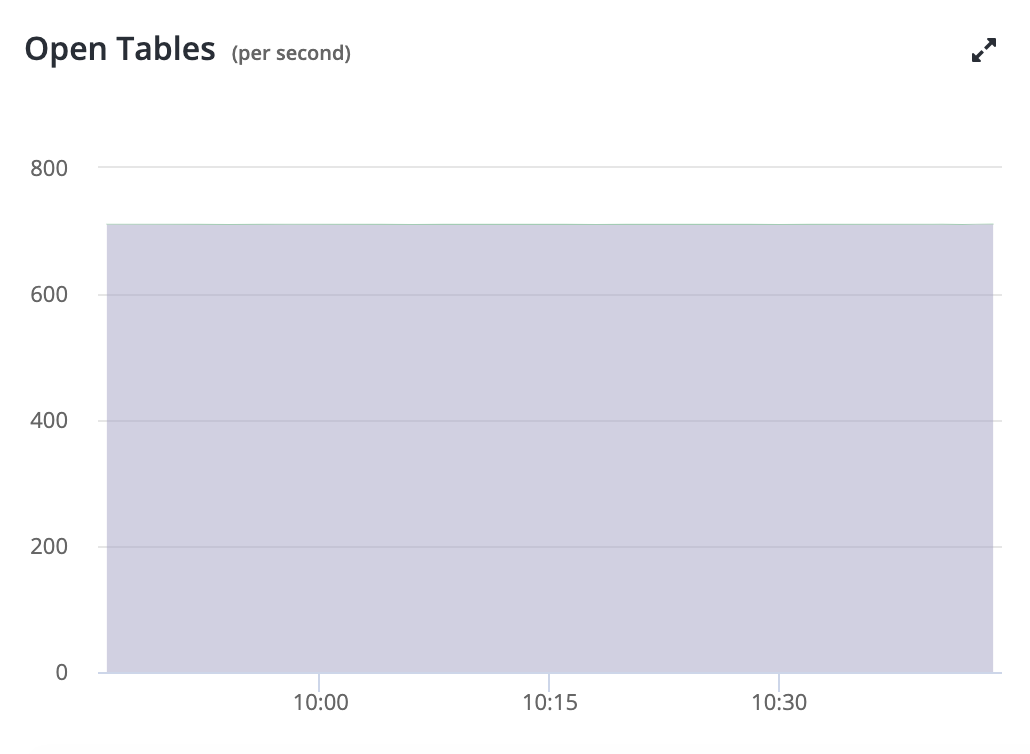
Open Tables metrics related to tables opened by MySQL server:
- Open: Number of tables that are open (purple)
- Opened: Number of tables that have been opened/sec (blue)
- Hit: Number of hits for open tables cache lookups/sec (grey)
- Miss: Number of misses for open tables cache lookups/sec (orange)
- Miss Overflow: Number of overflows for the open tables cache/sec (yellow)
- Hit Ratio: Hit ratio (green)
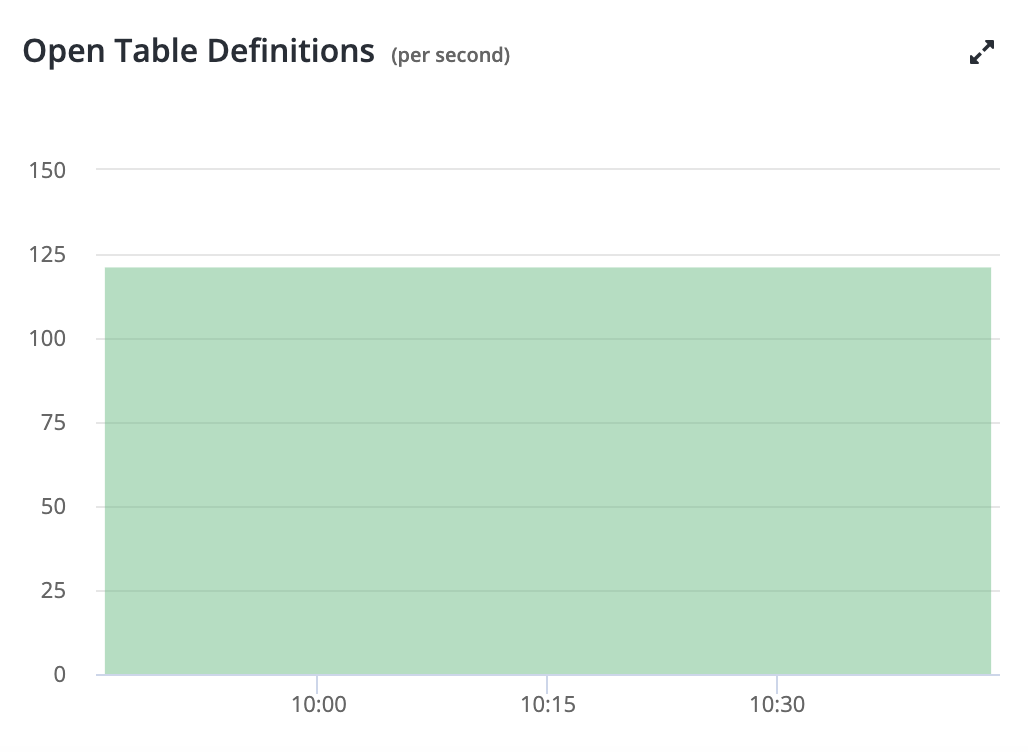
Open Table Definitions
Open Table Definitions (per second) metrics related to table definitions:
- Open: Number of cached .frm files (green)
- Opened: Number of .frm files that have been cached/sec (purple)
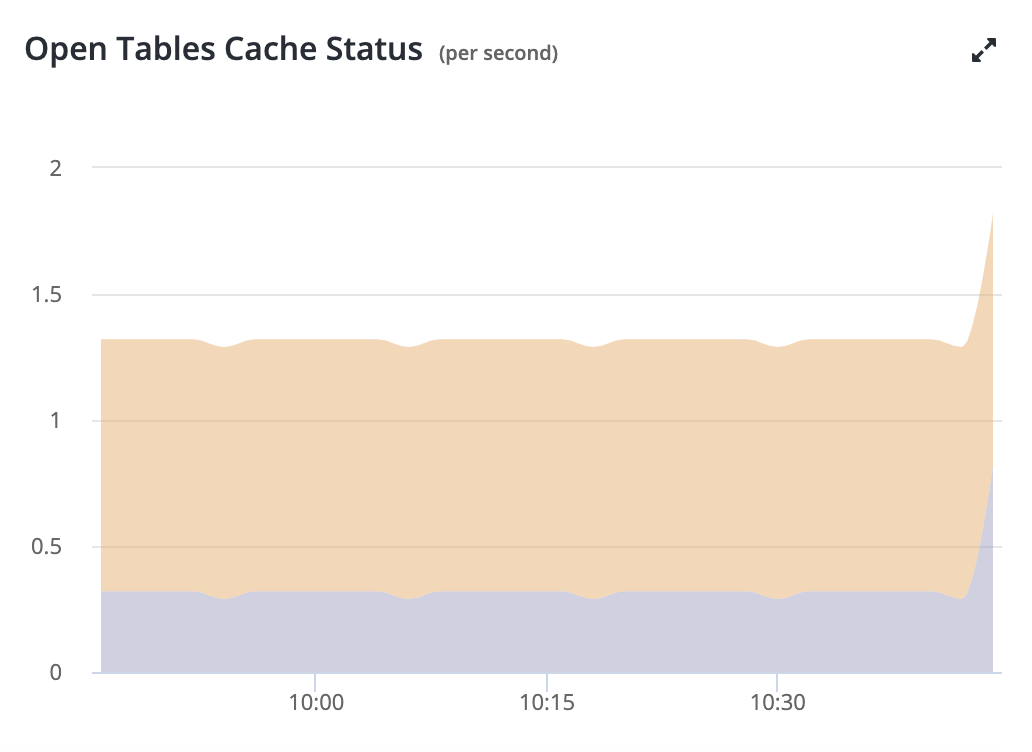
Open Table Cache Status
Open Tables Cache Status:
- Hit: Number of hits for open tables cache lookups/sec (purple)
- Miss: Number of misses for open tables cache lookups/sec (green)
- Miss Overflow: Number of overflows for the open tables cache/sec (grey)
- Hit Ratio: Hit ratio (orange)
Updated 12 months ago
