MySQL Slow Query Analyzer
ScaleGrid's MySQL Slow Query Analyzer helps you easily identify problem queries in your MySQL cluster running in the cloud.
The Slow Query Analyzer helps you easily identify problem queries in your MySQL hosting cluster running on ScaleGrid.
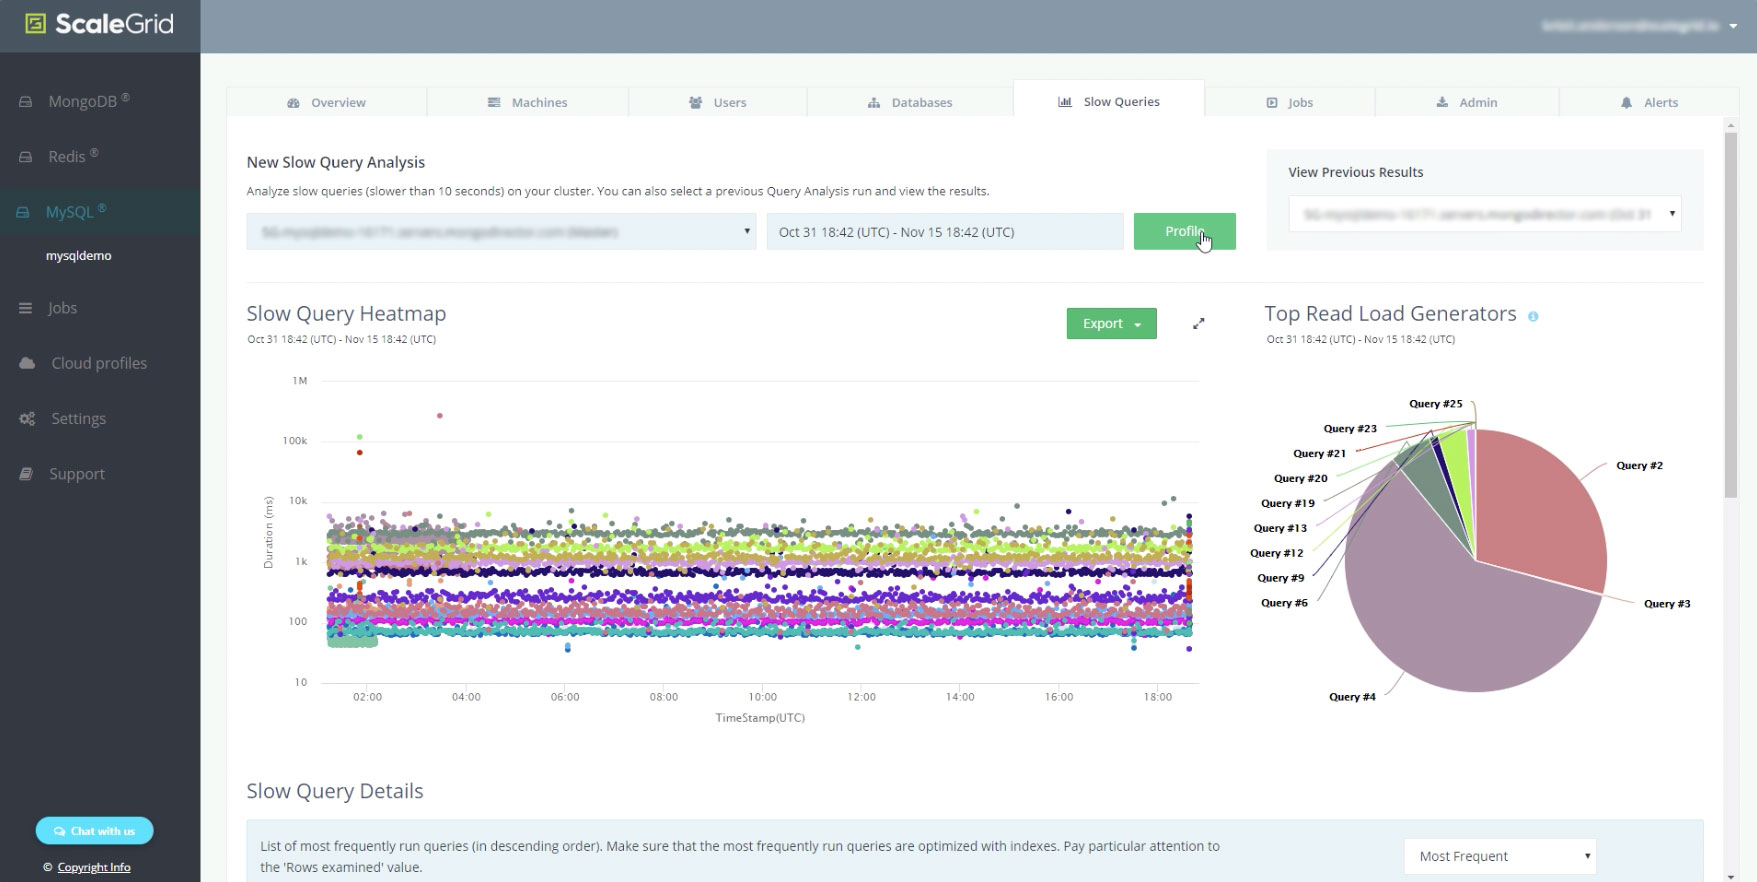
Create a Slow Query Heat Map Report
- Navigate to your MySQL Cluster Details page.
- Click on the 'Slow Queries' tab
- Select the server you're interested in analyzing.
- Select the time range. By default you can pick last hour, 3 hours, 6 hours, 24 hours, or a custom time range.
- Click profile to analyze your MySQL slow queries.

Once that is done, you’re presented with a heat map of all the queries in your system for your selected time range. All queries of the same type have the same color so you can get a good idea of the clustering of the different queries running in your system.
The X-axis is for time, and the Y-axis is the duration of the queries. The higher up the queries, the slower it is.
Hover or click over one of the bubble to get an idea of what sort of query is associated with it. You can also zoom into a particular time range to understand in detail what is going on over that period of time.
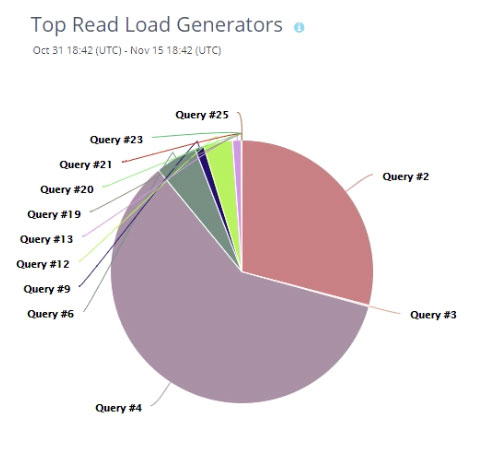
Top Read Load Generators
On the right side, we present a pie chart to easily identify the top queries causing the read load in your system. This is a quick one glance way to identify queries that are typically not indexed.

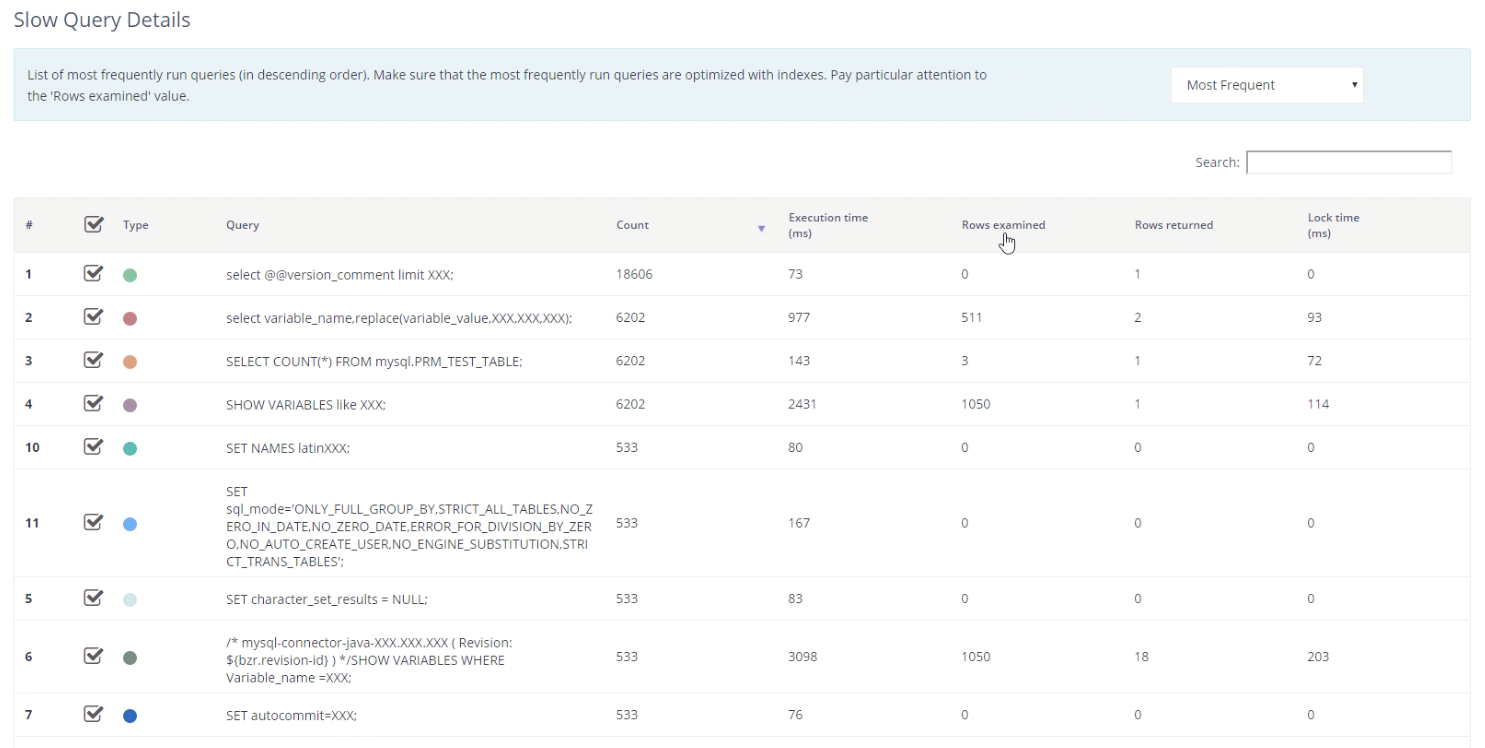
Slow Queries Detailed Table Report
If you scroll down, the data is presented in a tabular format:
- Count (default): Sort queries are sorted by frequency.
- Execution time (ms): Sort by which queries are taking the maximum amount of time to execute.
- Rows examined: Sort by queries examined - the maximum amount of rows. This is typically the query that is missing an index.
- Rows returned: Sort by the queries returning the maximum amount of rows
- Lock time (ms): Sort queries by lock time.

Customize a Filtered Query View
You can also control which queries show up in the heat map if you want a specific heat map for a particular query. Simply select the checkbox next to the particular query you’re interested in, and only those queries will show up on the heat map.
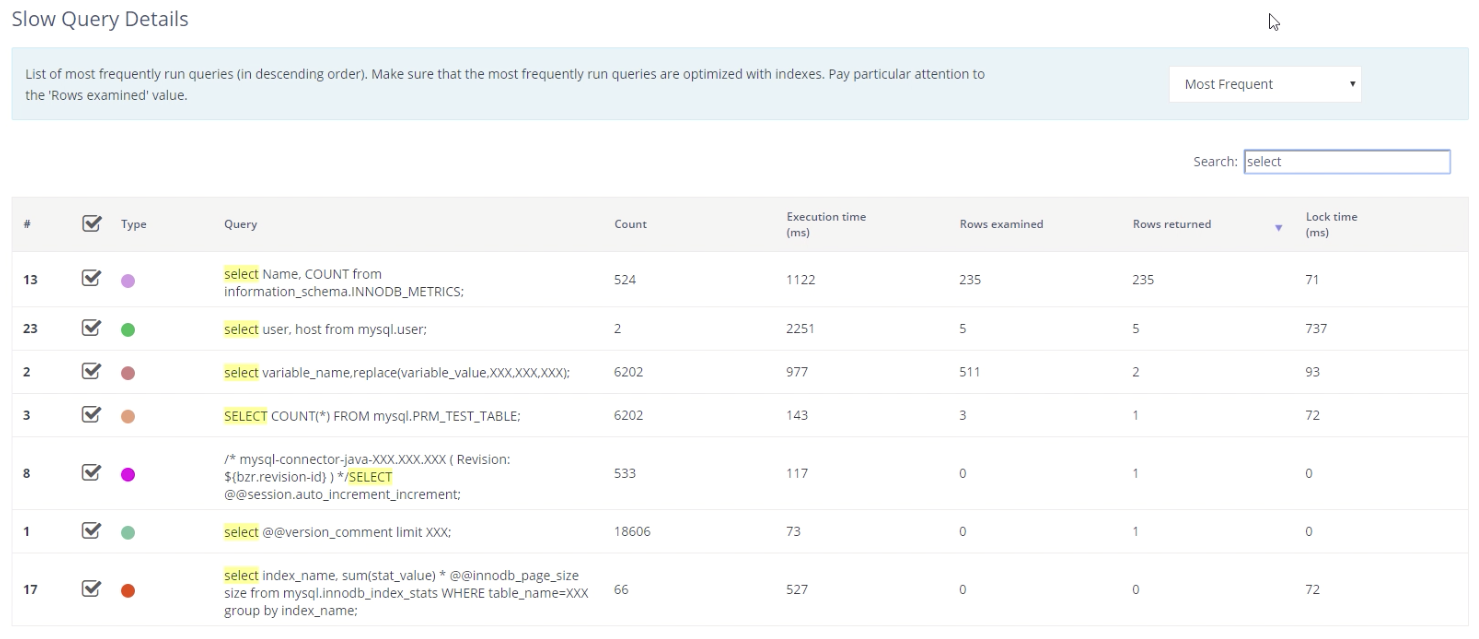
You can also filter your queries based on a particular string. For example, if you only want to analyze the 'SELECT' queries, enter this string into the search box above the table and this will filter the queries to only show those with SELECT.

Download Your Slow Query Analysis Report
Easily export all of your slow query analysis data.
- Download CSV: Export in a CSV format to open in excel for further analysis, and share with your team and do any sort of offline analysis that you want.
- Download PDF: You can also export as a report in PDF format to share with your team for a more detailed view of the slow query analysis.
On the top right, you can also view the previous slow query analysis that were run on your system and analyze through any of the above methods.
Customize Your Slow Query Analyzer Configurations
By default, the slow query threshold is set to 10 seconds. Follow these steps to customize your configurations:
- Navigate to the 'Admin' tab of your Cluster Details page
- Select the 'Configuration' tab on the left.
- Enter 'long_query_time' in the search box.
- By default, this is set to 10 seconds. You can change to a number desirable for your configuration.
- Click save to update the configuratable without any downtime on all of your servers.

That’s it for our slow query analyzer. If you have any further questions, reach out to us at [email protected].
Updated about 2 months ago
